Do you have a question about the atmosphere, weather or climate?
Ask Arthur
1. “why are some clouds dark?” – Karen jump to response
2. Hailstones, how are they made? – Arthur jump to response
3. Noctilucent clouds seen in Nebraska. – Ken jump to response
4. Explain the Moon’s Major and Minor Standstills. – Karen jump to response
5. Spectacular lightning photo from Gold Hill. – Gary Siemer jump to response
6. What makes tsunamis so different and destructive? jump to response
7. Observations of Equinox sunrises on the Gold Hill Town Meadow? jump to response
8. Is there a special “Blue Moon” on New Year’s Eve? jump to response
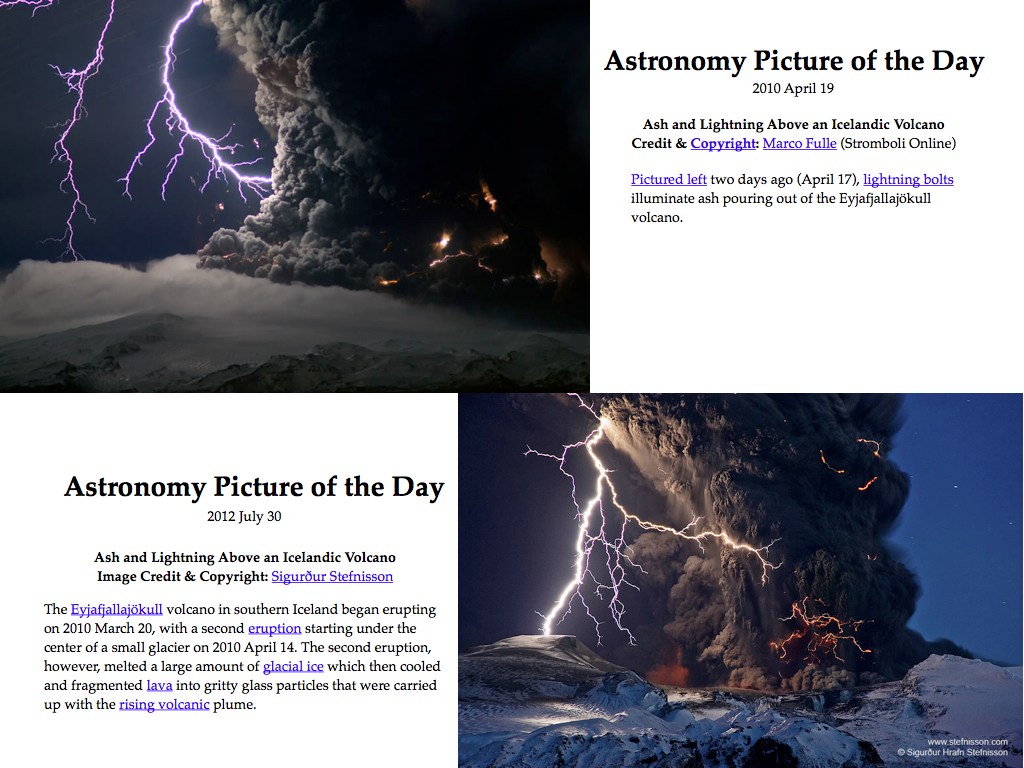
9. Why does the ash plume coming from the Icelandic volcano sometimes create lightning? – Ken Fernalld jump to response
10. Which day is the fall equinox, the 22nd or the 23rd? The TV news and the newspaper disagree. – Cherry jump to response
11. Fall equinox, Part 2, Special Days. Arthur jump to response
12. The Belt of Venus. Arthur jump to response
13. Is there a total lunar eclipse this December? Karen jump to response
14. Look! What are those sparkly things? Joan jump to response
15a. I’m not sure why they call this a gravity wave,… Ken jump to response
15b. So here’s a guy talking about gravity waves at the sea surface. Are they the same … in the atmosphere? Karen jump to response
16. Full perigee Moon and the vernal equinox: discussions at Donal’s St. Pat’s party 3/19/11 and the Sand’s soup dinner 3/20/11; also Kris’s question 2/1/10 regarding the full Moon’s LARGENESS. jump to response
17. The boys and I will be in Gold Hill on the solstice; can we celebrate? Kellie jump to response
18. The aurora is occasionally seen far south of it's usual high latitude location. What conditions cause it to be seen far south? - Karen jump to response
19. Good Morning. Arthur jump to response
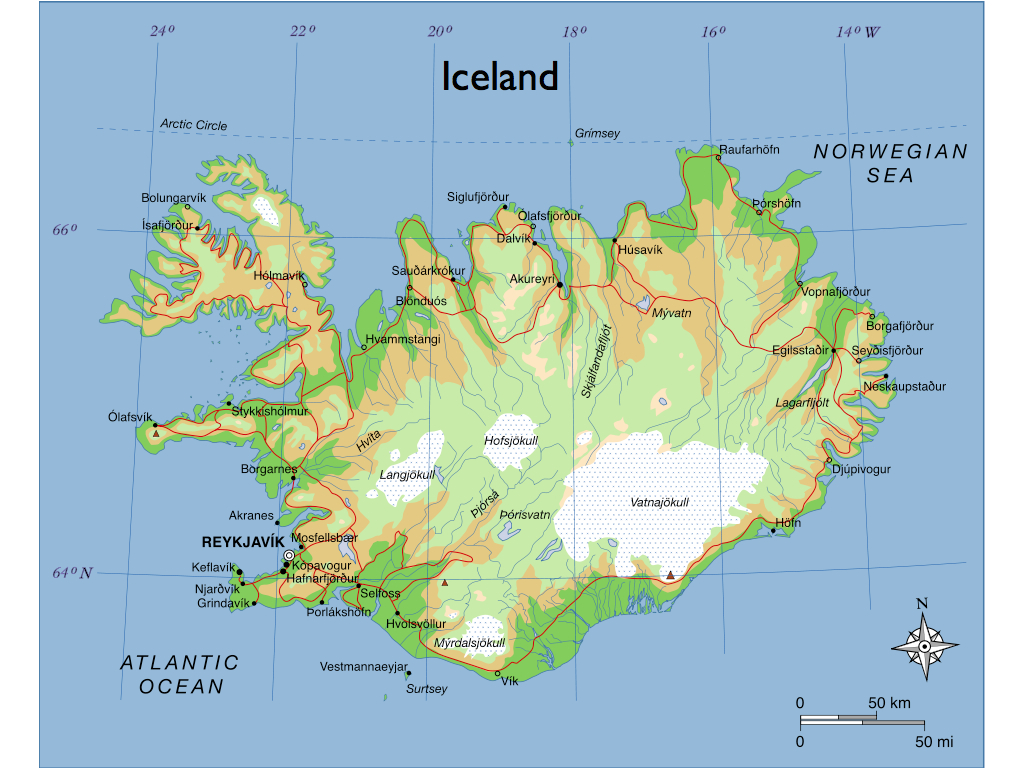
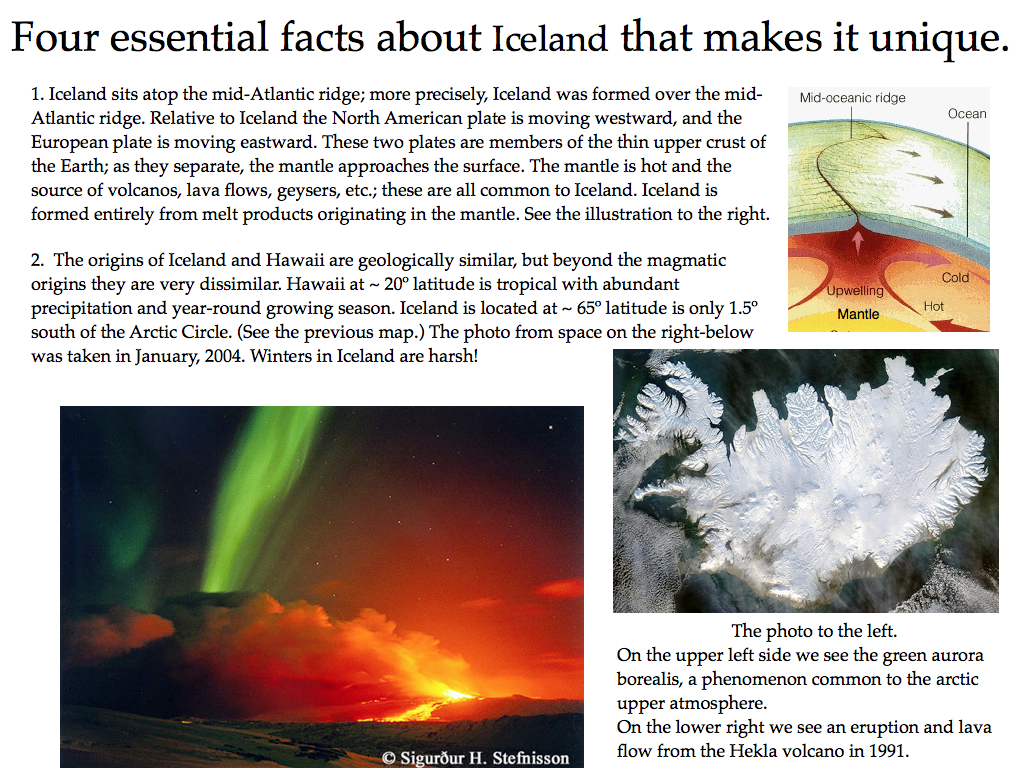
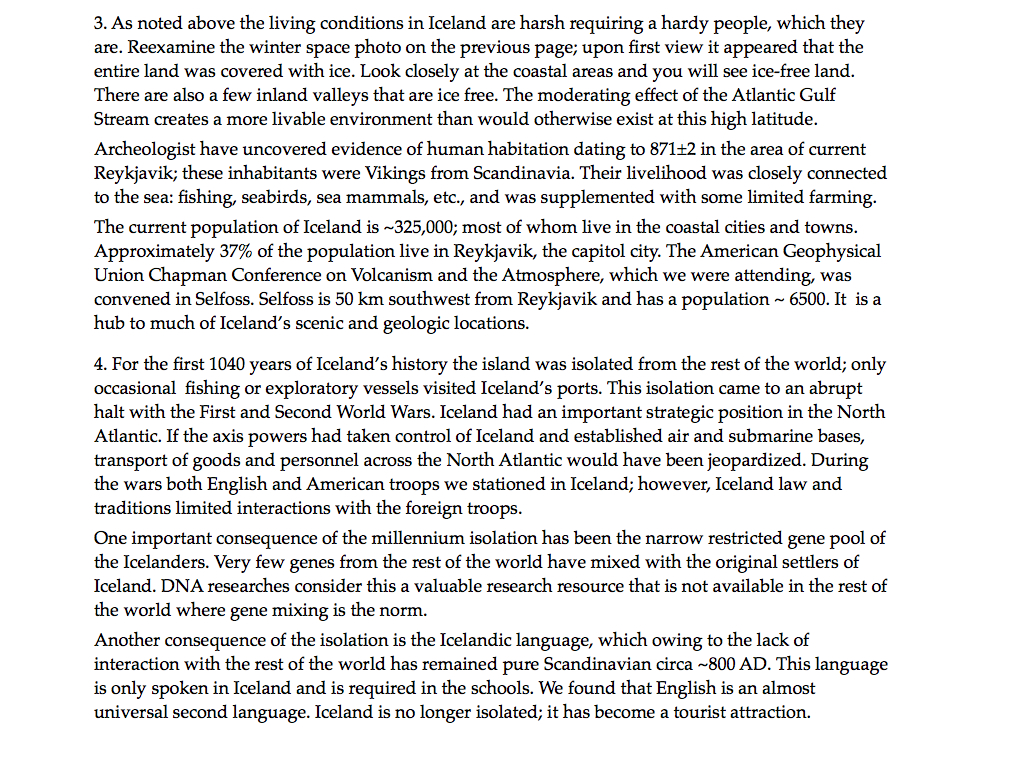
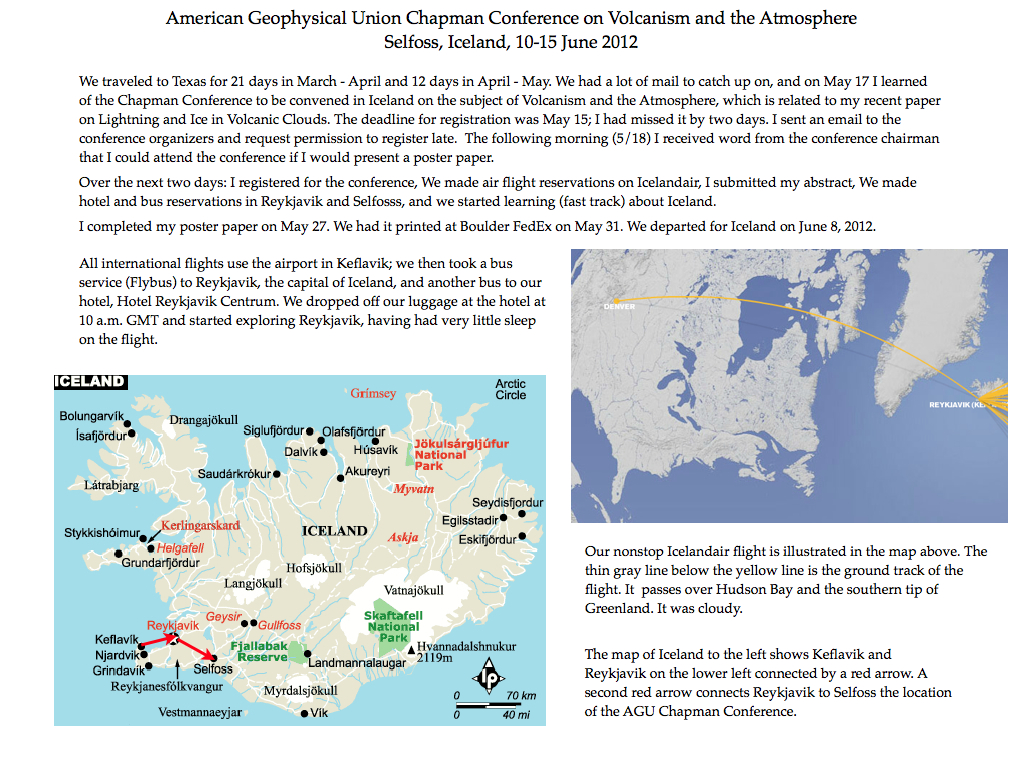
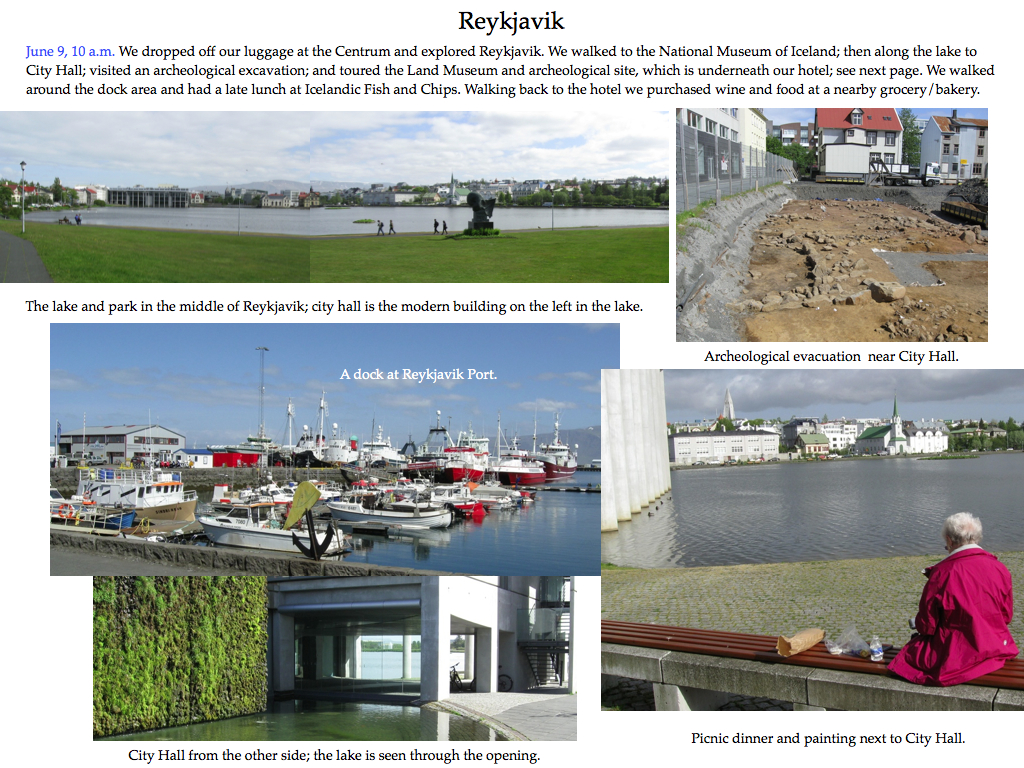
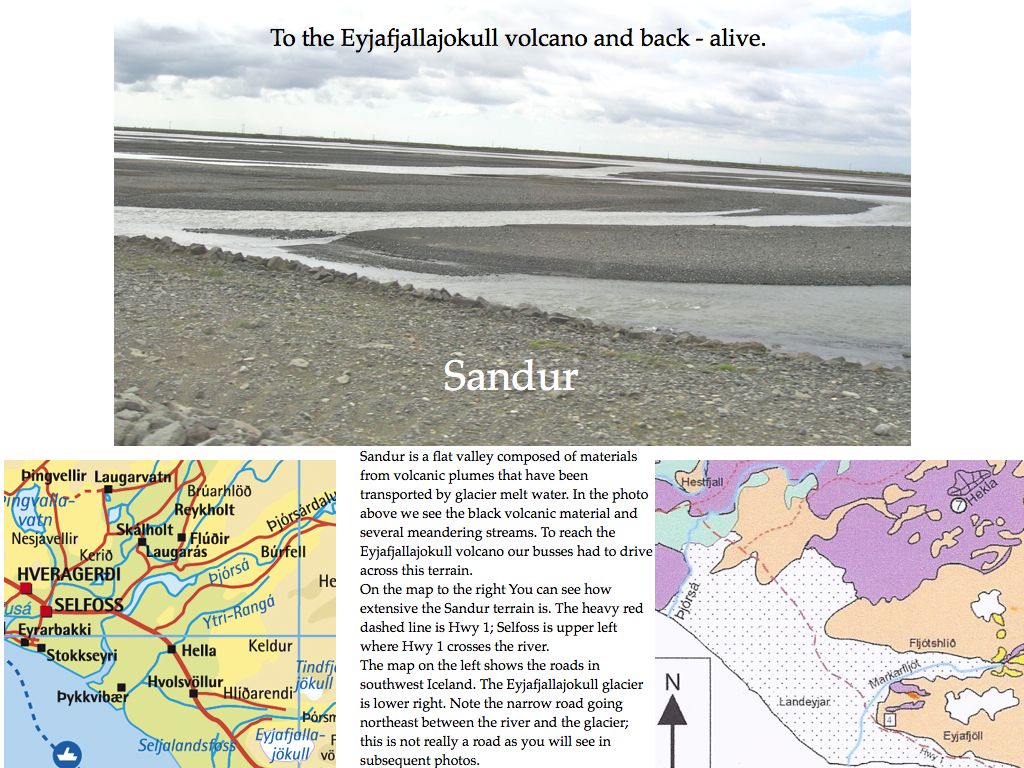
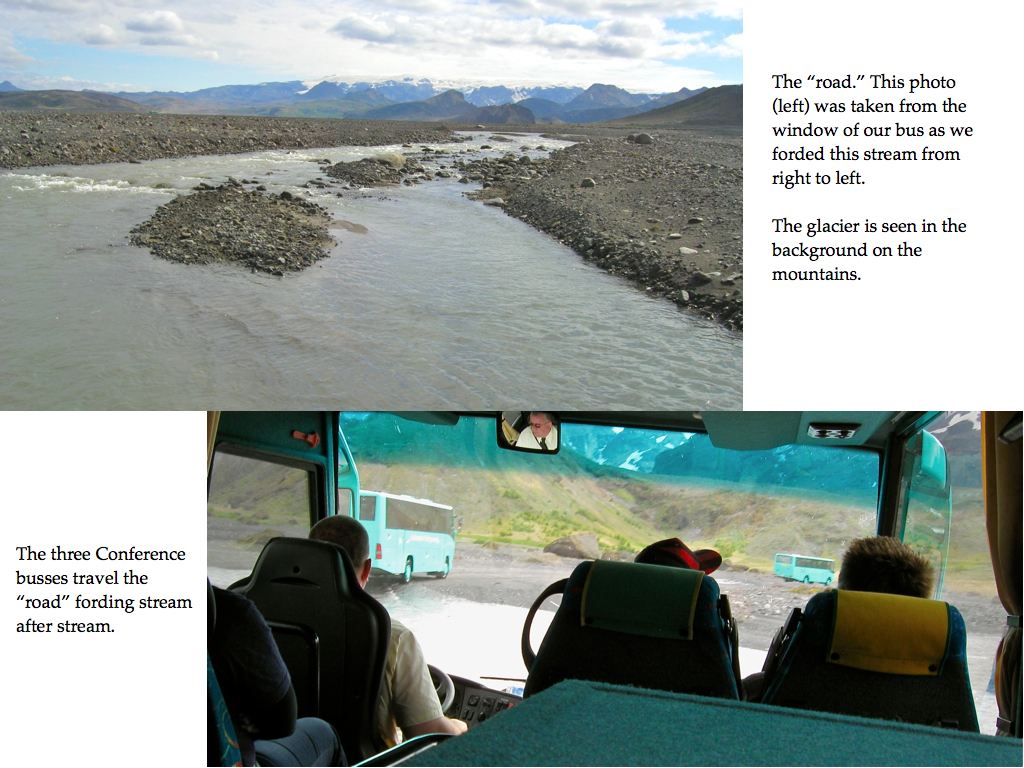
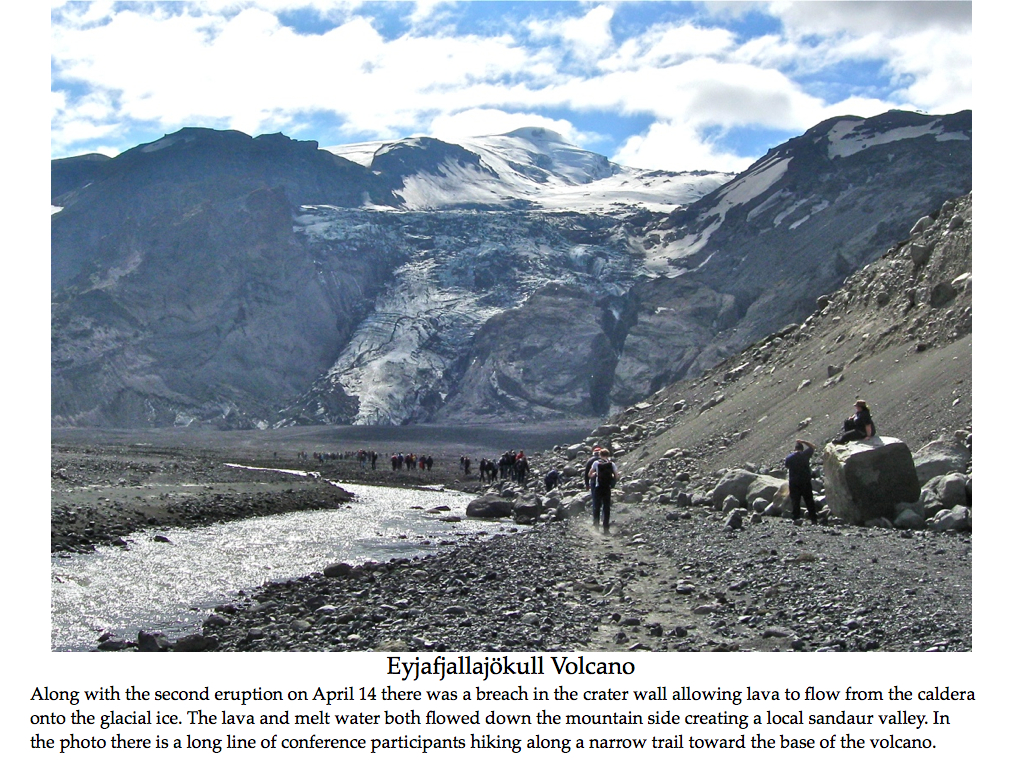
20. Arthur & Joan travel to Iceland to attend the AGU Chapman Conference on Volcanism and the Atmosphere jump to response
1. ”why are some clouds dark?” – Karen
Cloud particles are excellent and very efficient scatterers of sunlight; only the condensation nuclei in the center (if dark) will absorb light. A solar photon will experience many scattering events while traversing a cloud. (The distance between scattering events in a cloud is approximately 3 meters.) The scattering, which is by the Mie process, is predominately in the forward direction and retains its original color, but with the frequent scattering events the final direction becomes somewhat random. Cloud tops and illuminated sides are white (Sun color) because what we see is being scattered by cloud particles near the edge. Small clouds also have white to light gray bases because the exiting photons have experienced limited scattering. For tall or thick clouds the photons exiting the base are small in number (dark) because most of the Solar photons have been scattered outward higher in the cloud.
2. Hailstones – Tracing Their Development
Arthur and family members experienced a severe hailstorm while on a Texas Archeological Society Field School in the Texas Panhandle this past June. This storm produced softball size hail; Arthur collected some of the hailstones and has produced a short slide lecture on the development of baseball size hailstones. To view a PDF version of the lecture which includes photographs of hailstones and their structure, go to Arthur Few’s Web Site where you can download the PDF file.
3. Noctilucent clouds seen in
Nebraska. – Ken
This summer
there have been documented sightings of noctilucent
clouds as far south as Montana(2), Wyoming(1), and
Nebraska(1?); the usual region for seeing them is
northward into Canada.
NASA photo of a Noctilucent Cloud.
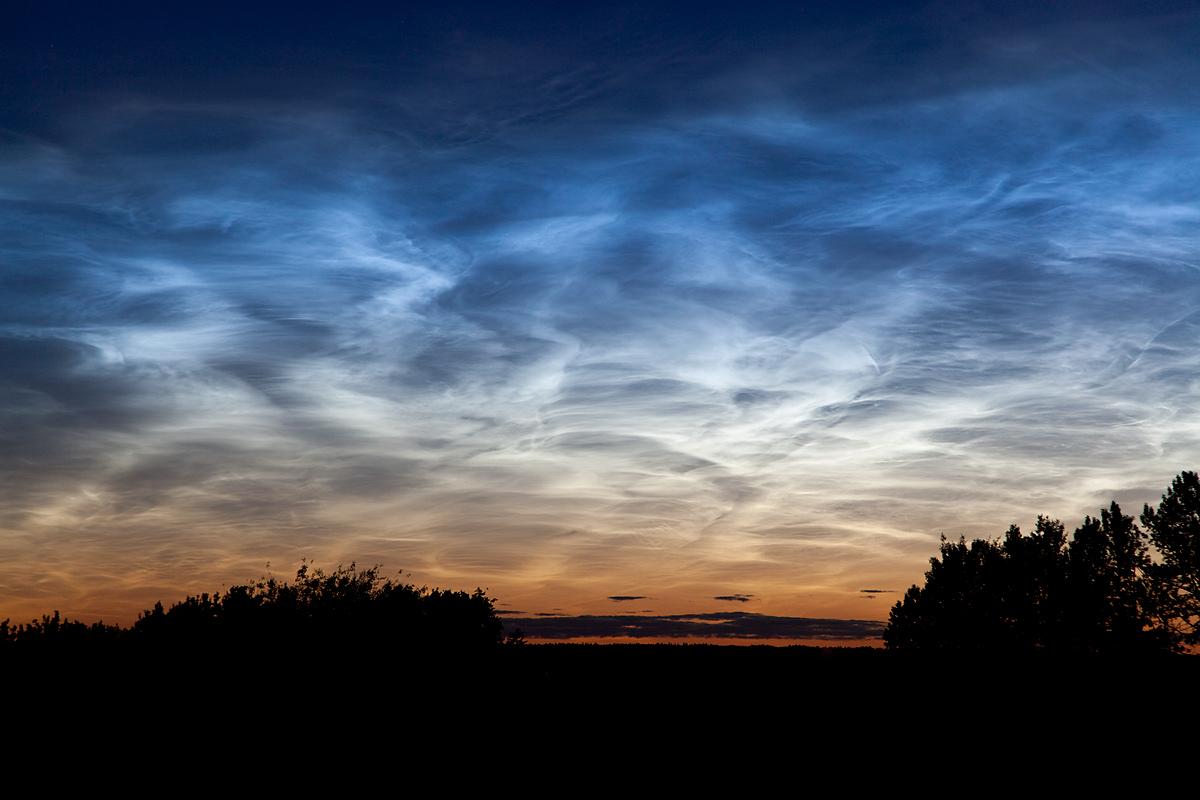
Credit:
NASA/Dave Hughes, 7/2/2011, Edmonton, Alberta Canada.
Noctilucent clouds
are very special for a number of reasons:
1. They are very
high, between 75 and 85 kilometers, in the upper
mesosphere just below the region of the aurora and the
ionosphere. See figure below.
2. They form in
a region where there should, by ordinary processes, be
no water; yet they are composed of ice.
3. They may be a
recent phenomenon; there are no reports of sightings
prior to 1885, and there is an indication that they are
increasing in frequency.
4. They are only
visible at night and when the Sun is 6 to 16 degrees
below the horizon so that the cloud is still
illuminated.
5. They only appear
in the summer, and usually between 50º and 70º
latitude.
So, how do they
exist?
1. It is
very unlikely that water from the lower atmosphere can
reach the altitude of noctilucent clouds because of (1)
the cold trap at the top of the troposphere where the
temperature is around -60º C and (2) the lack of
convection in the lower stratosphere. [ At -60ºC
& 200hP only 1 in 10,000 molecules can be water;
whereas, at mean surface conditions 1 in 100 can be
water molecules. One might say that a function of clouds
is to prevent water from reaching the upper atmosphere.
Without convection in the lower stratosphere there is no
dynamic vertical motion to transport water upward.]
2. Several
possible sources of the water are (1) micrometeoroids
which bring water and dust into the upper atmosphere,
(2) chemical reactions of methane with ions in the upper
atmosphere producing water, and (3) space-bound rockets
using hydrogen and oxygen fuels whose product is water.
[Micrometeoroids burn up upon entering the upper
atmosphere and do produce water and dust needed to form
the clouds. But, why no noctilucent clouds seen before
1885? The methane source can add additional water and
would be consistent with the human-produced increase in
methane and increasing frequency of noctilucent cloud
sightings. There have been confirmed instances of small
noctilucent clouds associated with space launches;
however, the rockets spend so little time passing
through the upper mesosphere that they could not by
themselves account for the needed quantity of water.]
3. Extremely
cold temperatures are required to produce ice clouds
with the scarce water available at these altitudes. [The
absolute coldest region of the atmosphere (-100ºC)
is in the high latitude mesosphere in the summer. One
would expect that noctilucent clouds would be visible
throughout this region, but inside the arctic circle the
Sun never sets so there is no darkness. The usual
observable latitudes are from 50º to 70º.
ref.http://en.wikipedia.org/wiki/Noctilucent_cloud
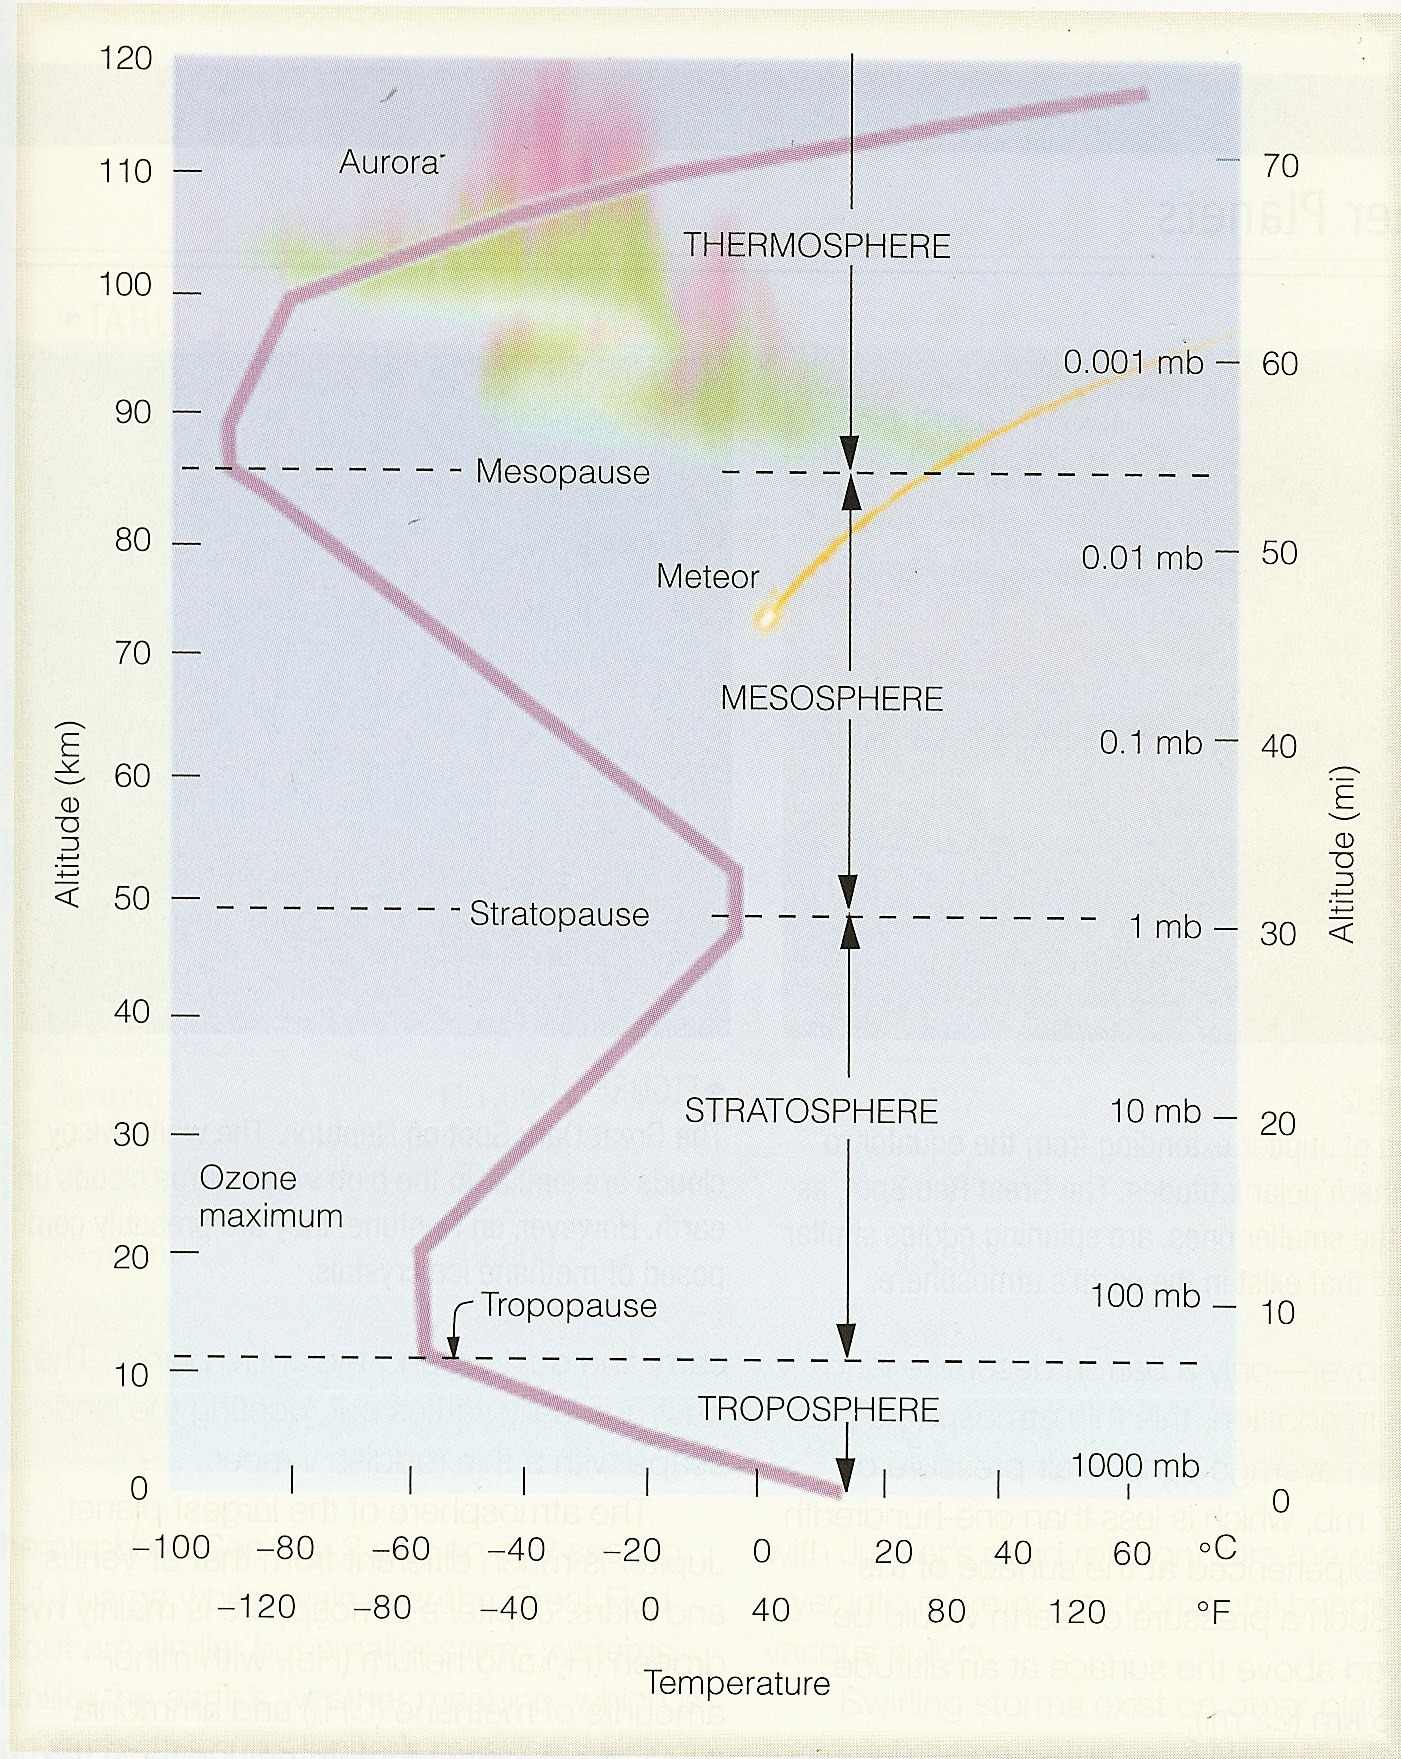
Graphic above from
Meteorology Today
by Ahrens
4. Explain the Moon’s Major and
Minor Standstills. – Karen
The Moon’s orbit is inclined ~5.1º to the ecliptic (the plane containing the Earth’s orbit). The Earth’s rotational axis has a angle of 23.5º to the ecliptic. Owing to gravitational influences the Moon’s orbital tilt axis rotates with respect to the Earth’s spin axis with a period of 18.6 years. When aligned parallel the two axes add to produce a Moon declination of 28.6º; this is the Major Standstill. 9.3 years later (half of 18.6 years) the Moon’s orbital axis is anti-parallel to the Earth’s spin axis, and the Moon’s declination is 18.4º; this is the Minor Standstill. The last Major Standstill was centered on 2006 and the next will be centered on 2025. The next Minor Standstill will be centered on 2015. The period is long, and I use the term “centered on” because the standstills do not change much in a couple of years and vary with the observer’s latitude. To view a slide lecture (PDF) on the Standstills, which includes a photograph of a Moon set in Gold Hill near the last Major Standstill, go to Arthur Few’s Web Site where you can download the PDF file.
5. Spectacular lightning photo from
Gold Hill. – Gary Siemer
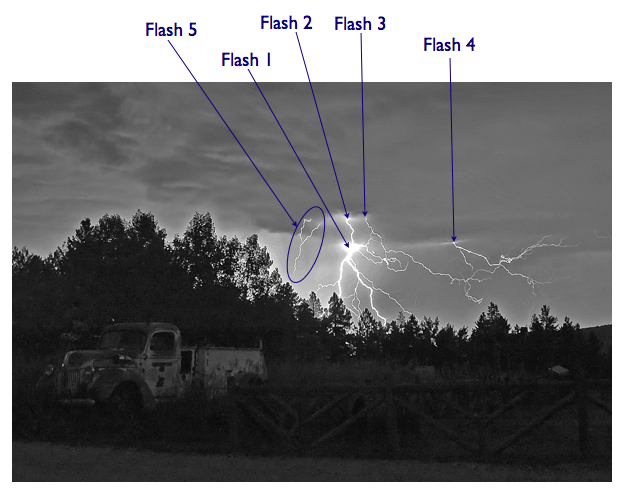
The photograph above was taken by Gary Siemer around 10P on Thursday August 6, 2009, from in front of the Gold Hill Inn. This is a time exposure (~30 s) using a tripod. In the photo we see five lightning flashes all from the same thundercloud and occurring within the 30 second exposure. Photograph used with the permission of Gary Siemer.
Take note of the bright spot on the cloud base where the flash exits the cloud.
Flash 1. This is the brightest of the flashes and probably the first. In technical terms this is a negative, multi-stroke, forked, cloud-to-ground flash; it is fairly common. Negative means that negative charge is transported to the ground. Multi-stroke means there is more than one current surge from the ground. Forked means that at least two of the branches contact ground; some of the dimmer branches may or may not have made ground contact.
Flash 2. The channel of this flash passes in front of the bright exit of Flash 1 making it difficult to trace the channel, but it appears that the channel branches in this region with one branch going to the right and the other proceeding in the original direction. The channel to the right branches again with the upper branch going toward the cloud base. The lower two branches terminate in the air.
Flash 3. Is highly tortuous as it proceeds downward at ~ 45º angle. About half way to the ground it branches; the lower branch executes an exotic dance, going first down then back up appearing to wrap around itself. (We are viewing a two dimensional projection of a three dimensional channel.) The upper branch of channel #3 proceeds upward passing in front of (?) channel #4 and into the cloud base.Technically this is an Intra-cloud discharge. There is a positive charge on the base of the cloud called a screening layer.
Flash 4. This flash is called an air discharge for obvious reasons; it does not terminate.
Flash 5. This is a winner and somewhat unusual. It is an upward discharge; we know this from the way that channel branches upward and into the cloud base. It probably originated from a distant mountain peak or power-line tower. Tall structures (e.g. the Empire State Building) frequently eject these upward flashes. This flash was probably triggered by the large electric field surge from nearby Flash 1 and occurred immediately following #1.
6. What makes tsunamis so different and destructive?
A tsunami is a special type of gravity wave. Gravity waves can occur in any fluid in which density decreases with height. In the atmosphere density decreases with altitude; thus we have atmospheric gravity waves in the stable layers of the atmosphere. Oceans have constant density; however, at the surface (ocean – air interface) the density decreases by approximately a factor of 1000. This provides an excellent condition for gravity waves. All ocean surface waves are gravity waves. The wavelength of an ocean surface wave is the length between adjacent wave peaks. When the water depth is greater than the wavelength the waves are ordinary or deep-water waves; when the water depth is smaller than the wave length then they are shallow-water waves, and you can get tsunamis. The average depth of the oceans is 3.8 km; thus the wavelength of an ocean tsunami is many km. Over the open ocean the height of a tsunami will be less than 1 m making them difficult to detect. An important property of tsunamis is that the deeper the water the faster they travel. As the tsunami approaches land the leading part of the wave slows down while the following part catches up forming a very large and destructive flooding wave.
To view a PDF version of a lecture on tsunamis, go to Arthur Few’s Web Site where you can download the PDF file.
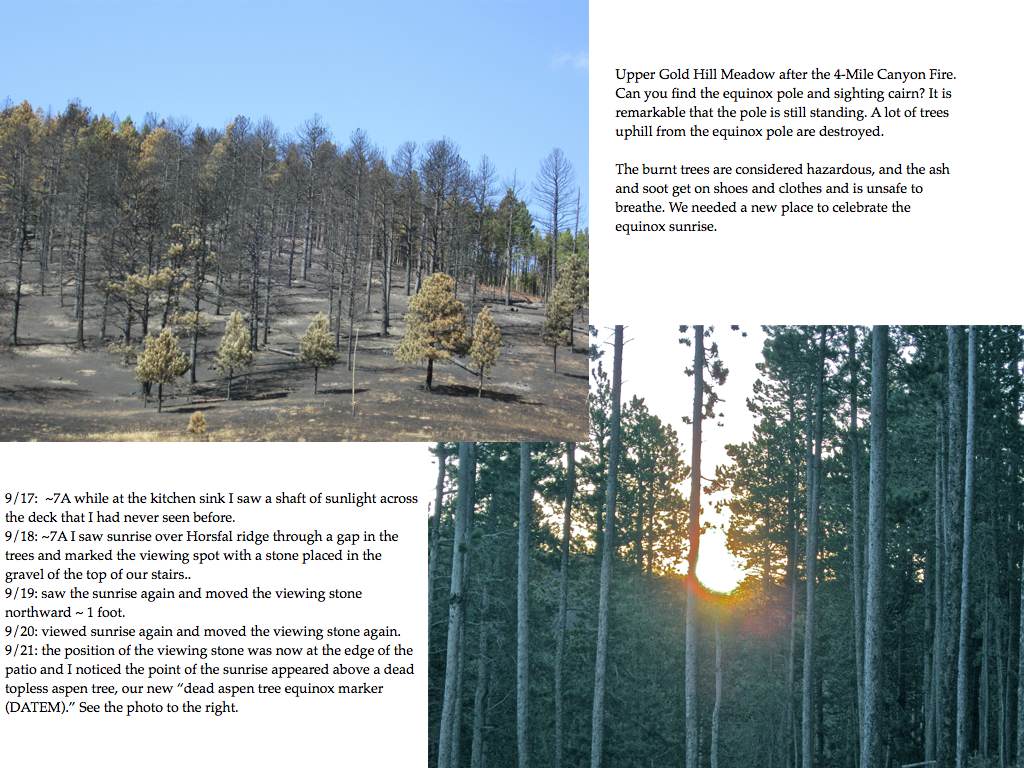
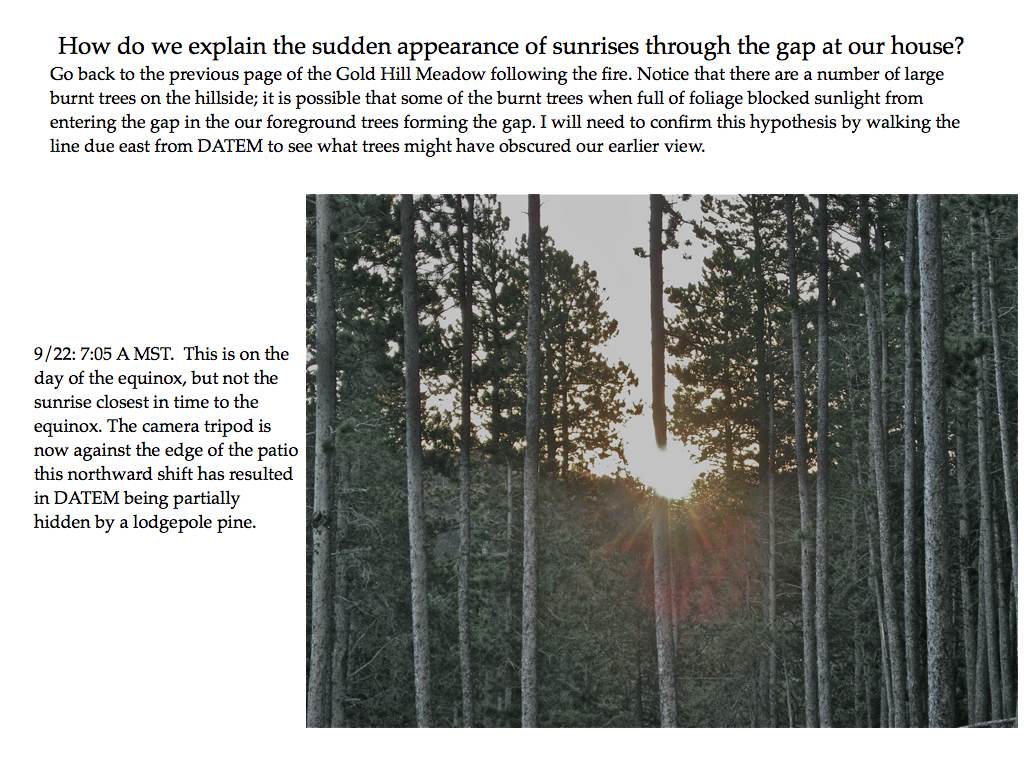
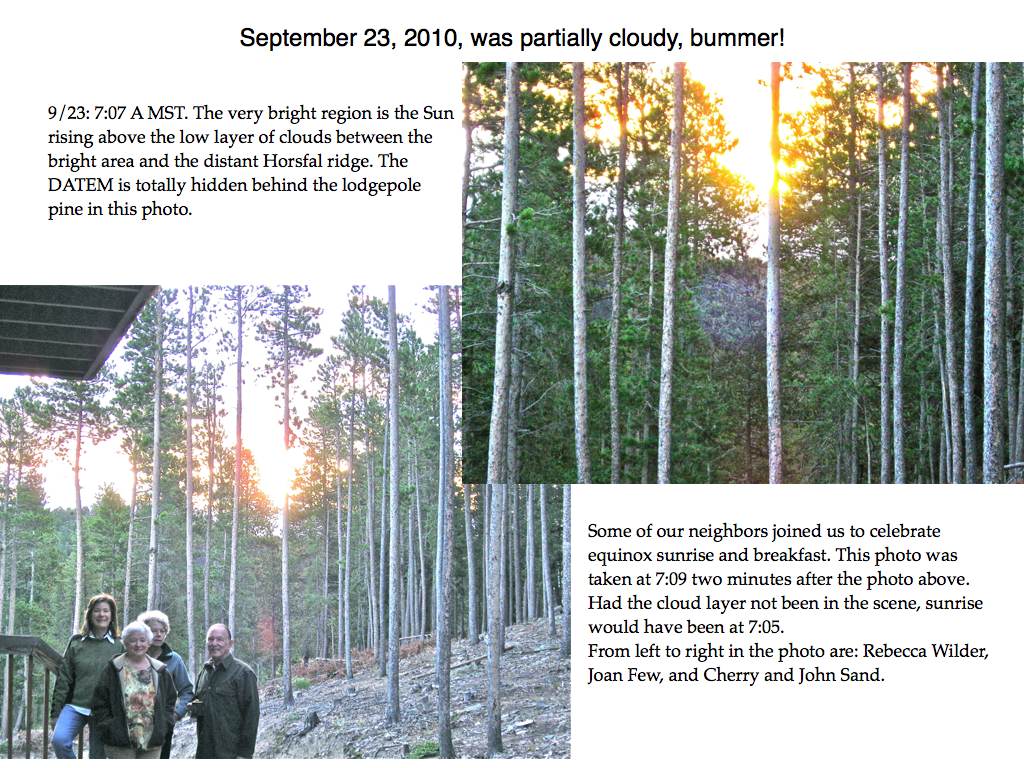
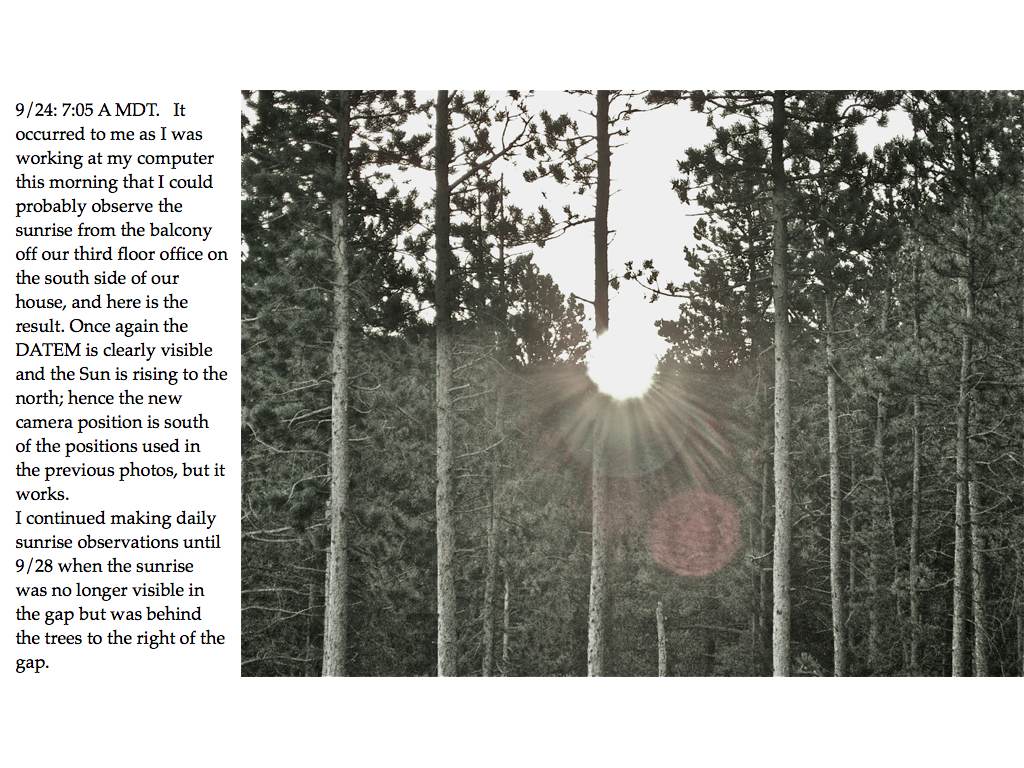
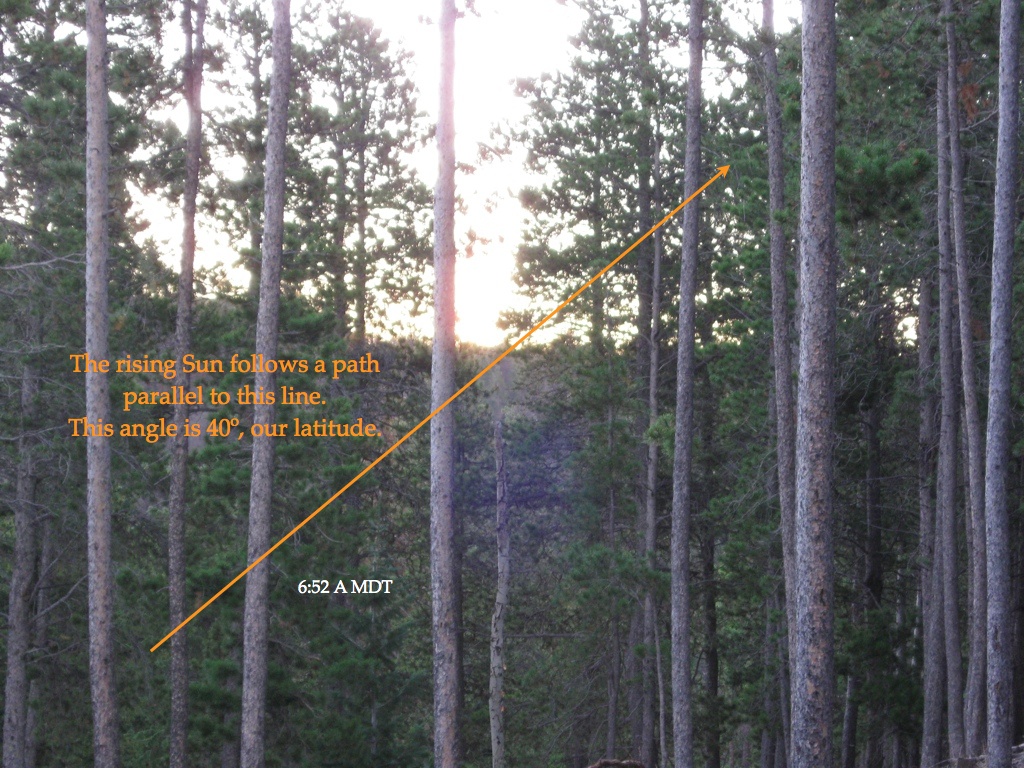
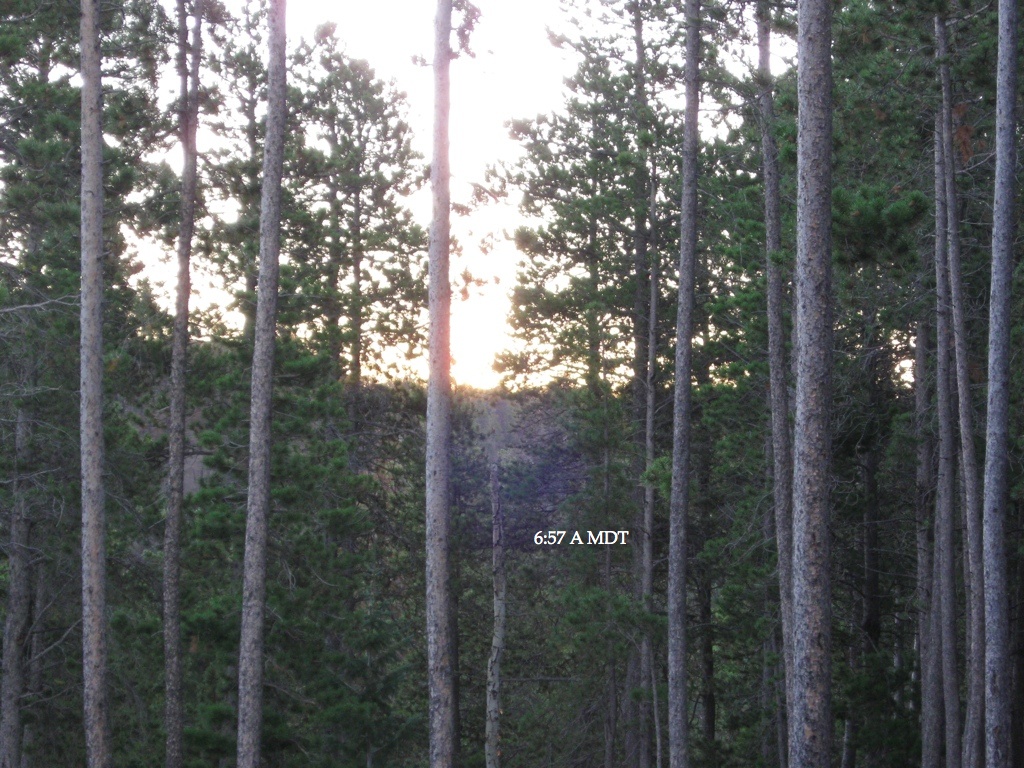
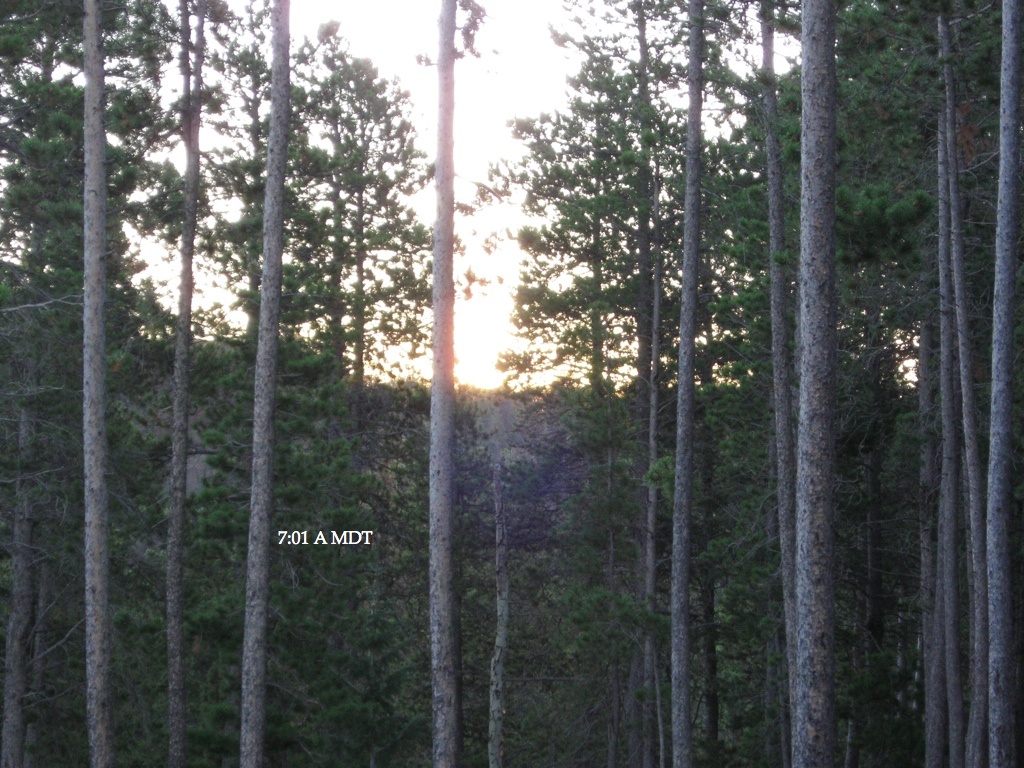
7. Observations of Equinox sunrises on the Gold Hill Town Meadow?

There are two photos above; the lower photo is of equinox sunrise on 9/22/08 at 7:28, and the Sun is rising directly behind the equinox pole. Clouds obscured the sunrise September 22 and 23, 2009, so no photos were obtained of the sunrise. However, broken clouds on 9/24/09, equinox + 2 days, allowed sunrise photos between gaps in the clouds. The upper photo was taken 9/24/09 at 7:36; the sunrise this day was at 7:34, but the Sun was behind a cloud at that time. Had our sunrise photo 2009 been taken on the Equinox, the Sun would have been behind the pole as it was in 2008; note how far to the south the sunrise has shifted in two days. Computations show that in two days, the time of sunrise is delayed by two minutes, and the angle to the sunrise position shifts 1º southward.
8. Is there a special “Blue Moon” on New Year’s Eve?
On New Year’s eve, 2009, we will have a Blue Moon. The astronomical Blue Moon has been defined in various ways over time, but mostly (since 1946) it relates to the occurrence of a second full moon in a calendar month. The last time that we had a Blue Moon on December 31 was in 1990, and the next time will be 2028. Months with 31 days are more likely to have a Blue Moon, and poor February can never have a Blue Moon.
The time between full Moons is 29.53 days. The mean year (including the leap-year effect) is 365.25 days. Thus the number of full Moons per mean year is 12.37. So, each mean year we have 12 full Moons, and we gain an extra 0.37 full Moons left over per year. The inverse of 0.37 is 2.7 or roughly 3 years. Approximately every 3 years we will have 13 full Moons, so in one of the 12 months (except February) we will have two full Moons and the second one is called a Blue Moon.
A previous method of defining a Blue Moon employed a solar-based calendar. The first day of the year was winter solstice and there were four quarters: Winter solstice to spring equinox, spring equinox to summer solstice, summer solstice to fall equinox, and fall equinox to winter solstice. In a normal year each quarter had three full Moons, but on the approximate 3-year cycle one of the quarters would have four full Moons. The Blue Moon was designated as the third full Moon in the quarter having four full Moons. Why the third? The church, using the ecclesiastical calendar determines the date of Lent and Easter using full moons; the Lenten Moon is the last full Moon of winter, and the Easter Moon is the first full Moon of spring. Easter is then the Sunday following the Easter Moon, and Lent starts on Ash Wednesday 46 days before Easter. The Lenten Moon occurs during this 46 day period. Since the dates of Lent and Easter are determined by full Moons and the equinox, having a fourth full Moon in the winter quarter would have to be the Lenten Moon, hence the Blue Moon would need to be the third. If the extra full Moon was the third then the ecclesiastical calendar would remain in the designated bounds. It is unclear when or why the term blue became attache to the third full moon in a quarter. Thankfully this usage has been trashed in favor of the second full moon in a calendar month.
See the photo below. As the Blue Moon was setting in the west on January 1, 2010, the Sun was rising in the east; in the photo the tops of the trees in the west are just being illuminated by the rising sun.
My thanks are extended to daughter Alice Few (web site) for providing Blue Moon websites (NASA, Sky and Telescope)
On December 31, 2009, we had a rather rare event; a Blue Moon occurring on New Year’s Eve. A Blue Moon is a second full Moon in a calendar month. This event will occur on New Year’s Eve only every 19 years; if you’re lucky and healthy you can experience this event again in 2028.
This photo was taken from our Gold Hill home as our Gold Hill Blue Moon was setting on 1/1/10 at 7:23 MST.

9. Why does the ash plume coming from the Icelandic volcano sometimes create lightning? – Ken Fernalld
Arthur’s response to the volcano lightning question has been moved to his web page. You can download the PDF response with the photographs at: http://www.ruf.rice.edu/~few/
10. Which day is the fall equinox, the 22nd or the 23rd? The TV news and the newspaper disagree. – Cherry
From an Earth-based perspective fall equinox corresponds to the passage of the Sun from the northern to the southern hemisphere. There are a couple of ways of visualizing this process. The subsolar point on the Earth’s surface is the point directly below the Sun. At that point the Sun would be directly overhead, at your zenith. At that moment no other place on Earth would see the Sun directly overhead. Subsolar points exist only in the tropics, between 23.5º north and 23.5º south. At the fall equinox the Sun’s subsolar point crosses the equator from north to south. We can also consider the Sun at local noon; at the equator on the fall equinox the noon sun moves from north to south. However, if you live at 40º north latitude, as we do, the noon Sun is never north of overhead. It moves from a little south to way south. Only if you are equator-ward of 23.5º (the tropics) will the noon Sun ever appear north of overhead. The sunrises and sunsets are more complicated and much more interesting for those of us not living in the tropics. The simplified version of this is that in northern hemisphere summer the sunrise and sunset points along the horizon are north of due east and due west; in winter the sunrise and sunset points are south of due east and due west. This movement of the sunrise and sunset positions is something that we (and all human cultures in the past) can easily observe. Stonehenge is a good example, and it is only one of many similar observatories.
The astronomical definition of equinox employs the ecliptic coordinate system defined by the Earth’s orbit about the Sun. In this system the Earth’s spin axis is directed 23.5º with respect to the ecliptic plane, but the direction of the spin axis is always pointed to a fixed direction in space near the North Star. As the Earth rotates around the Sun the relationship between the direction from the Sun to Earth and the Earth’s spin axes changes from -23.5º to +23.5º; the equinoxes (fall and spring) are defined as the moments in time when this angle passes through 0º. Equinoxes are moments in time not a designated day.
The common definition that day and night are equal on the equinox is not exactly true; the equal day and night date depends upon the time of the equinox and your latitude and longitude. This year, 2010, the fall equinox occurred at 3:09 UT on September 23; this corresponds to 9:09 p.m. MST on September 22. To illustrate that the length of night and day are not necessarily equal on the equinox we can calculate the length of the day (sunrise to sunset) in Gold Hill (latitude 40.06º, longitude 105.41º). On September 22 it is 12 hours and 10 minutes; on September 23 it is 12 hours and 7 minutes. The date that is closest to the equinox having equal day and night is September 26; on which the day is 11 hours and 59 minutes, one minute off equal day and night.
In Gold Hill we have traditionally celebrated equinox sunrise as opposed to sunset. The main reason being our topography lends itself best to observing sunrises. Which date, September 22 or 23, is most appropriate? Sunrise on the 22nd occurred 14 hours and 20 minutes from the equinox at 9:09 p.m.; whereas, on the 23rd it was 9 hours and 41 minutes. Sunrise on the 23rd is closer to the equinox than sunrise on the 22nd. That said; I made equinox observations on both dates as well a several days bracketing the equinox.
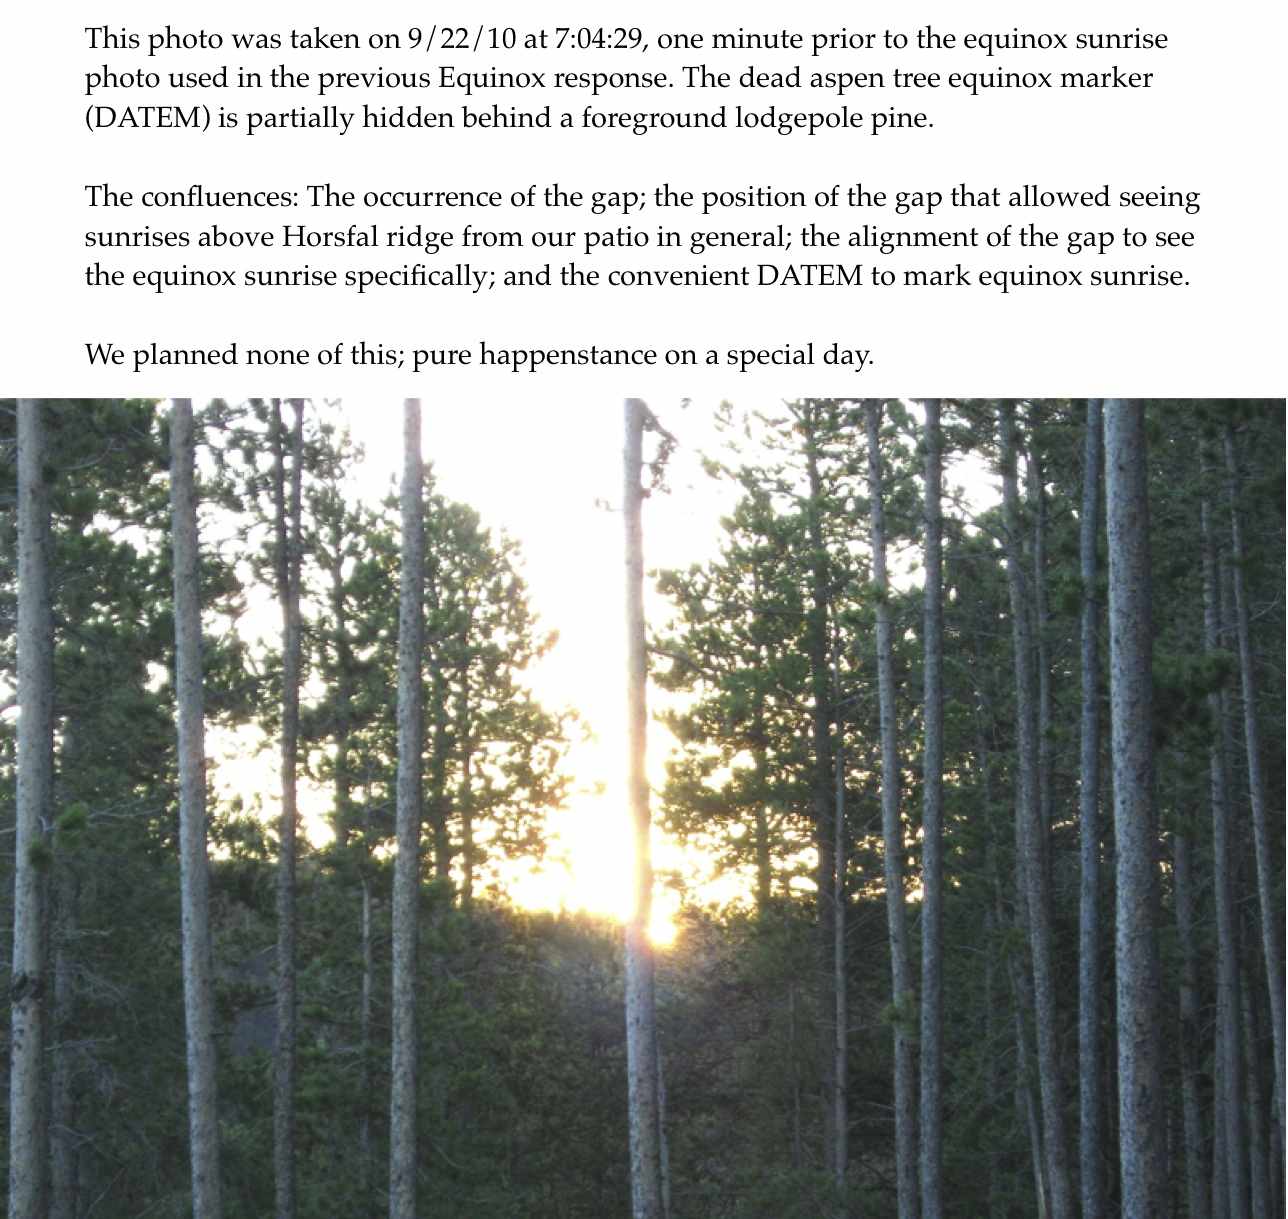
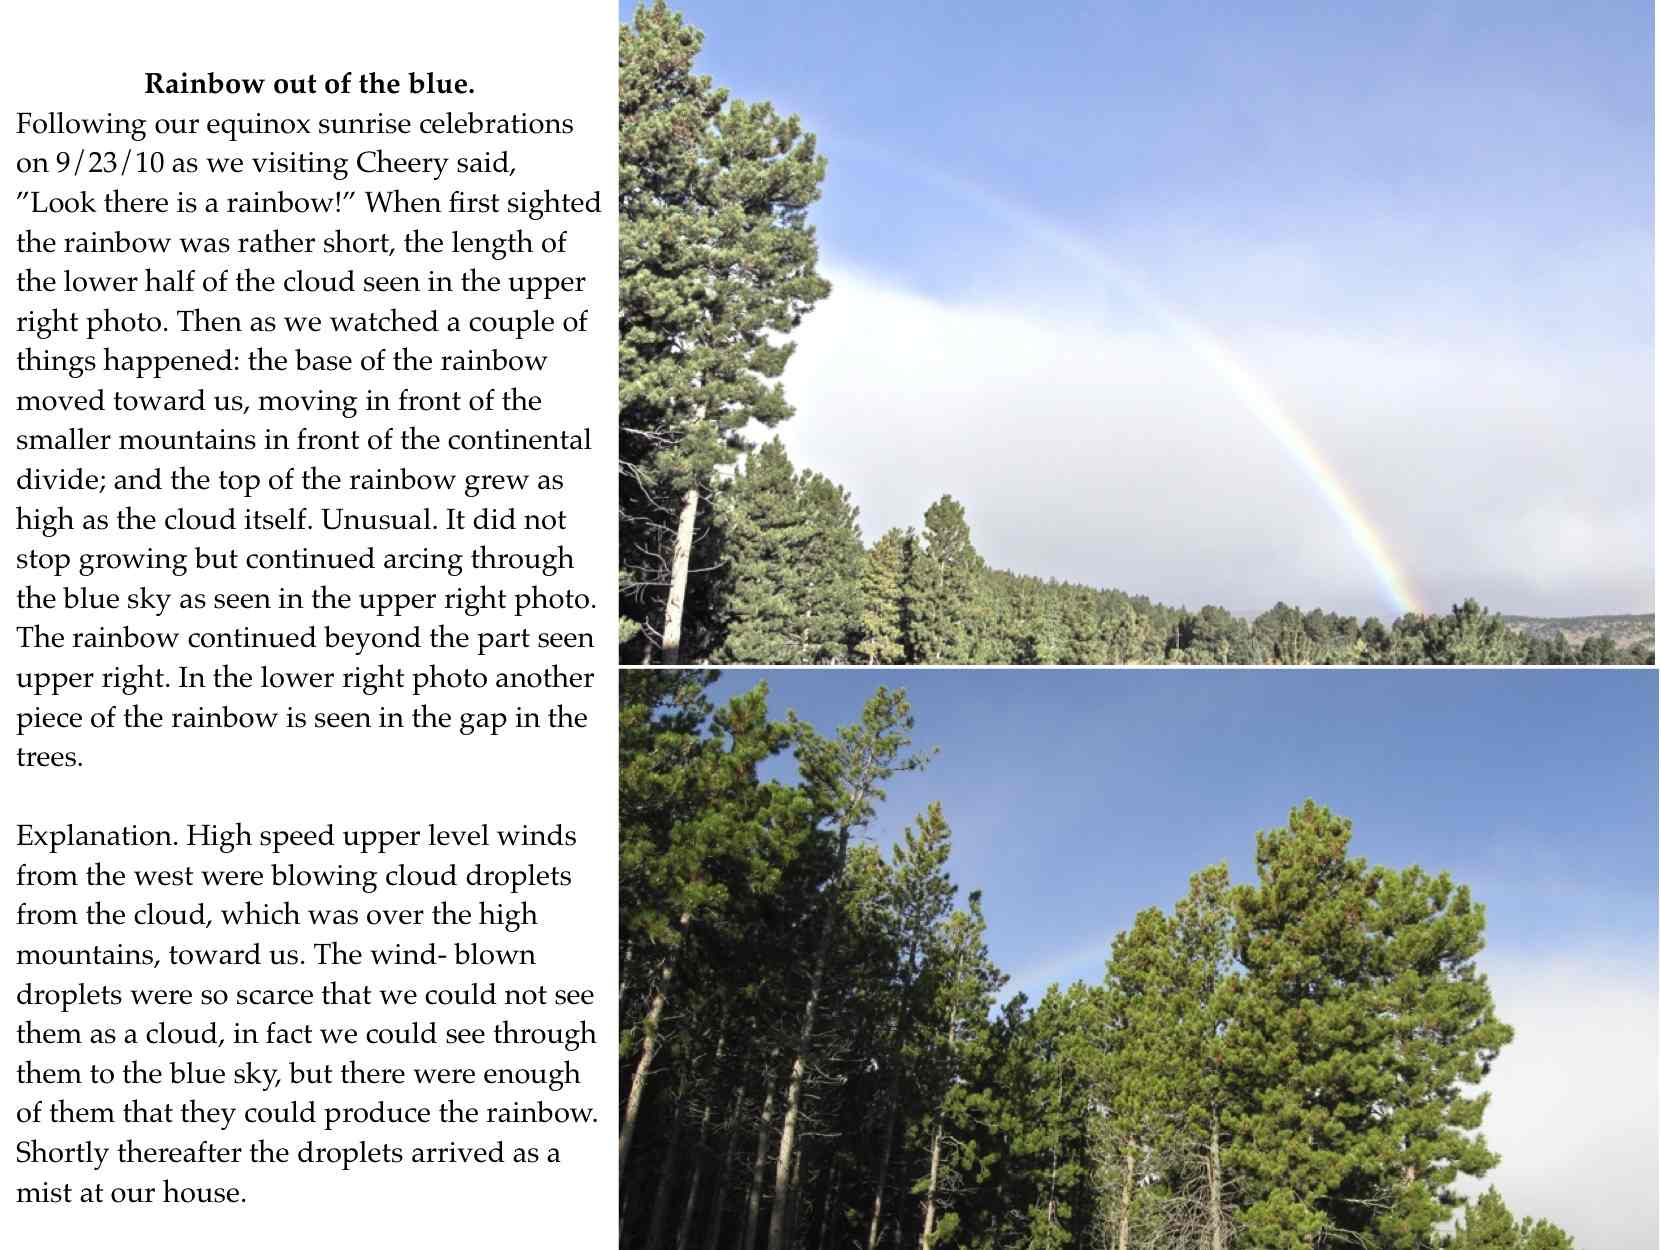
11. Fall equinox, Part 2, Special Days. Arthur
Some special days are special because of connections with the past such a birthdays, anniversaries, national holidays, etc. Other special days are special in their own right just because of the confluence of events of the day. The two fall equinox days of 2010, September 22 and 23, that were the subject of my previous “Ask Arthur” response on “Equinox” (Part 1) are special days of this second kind.
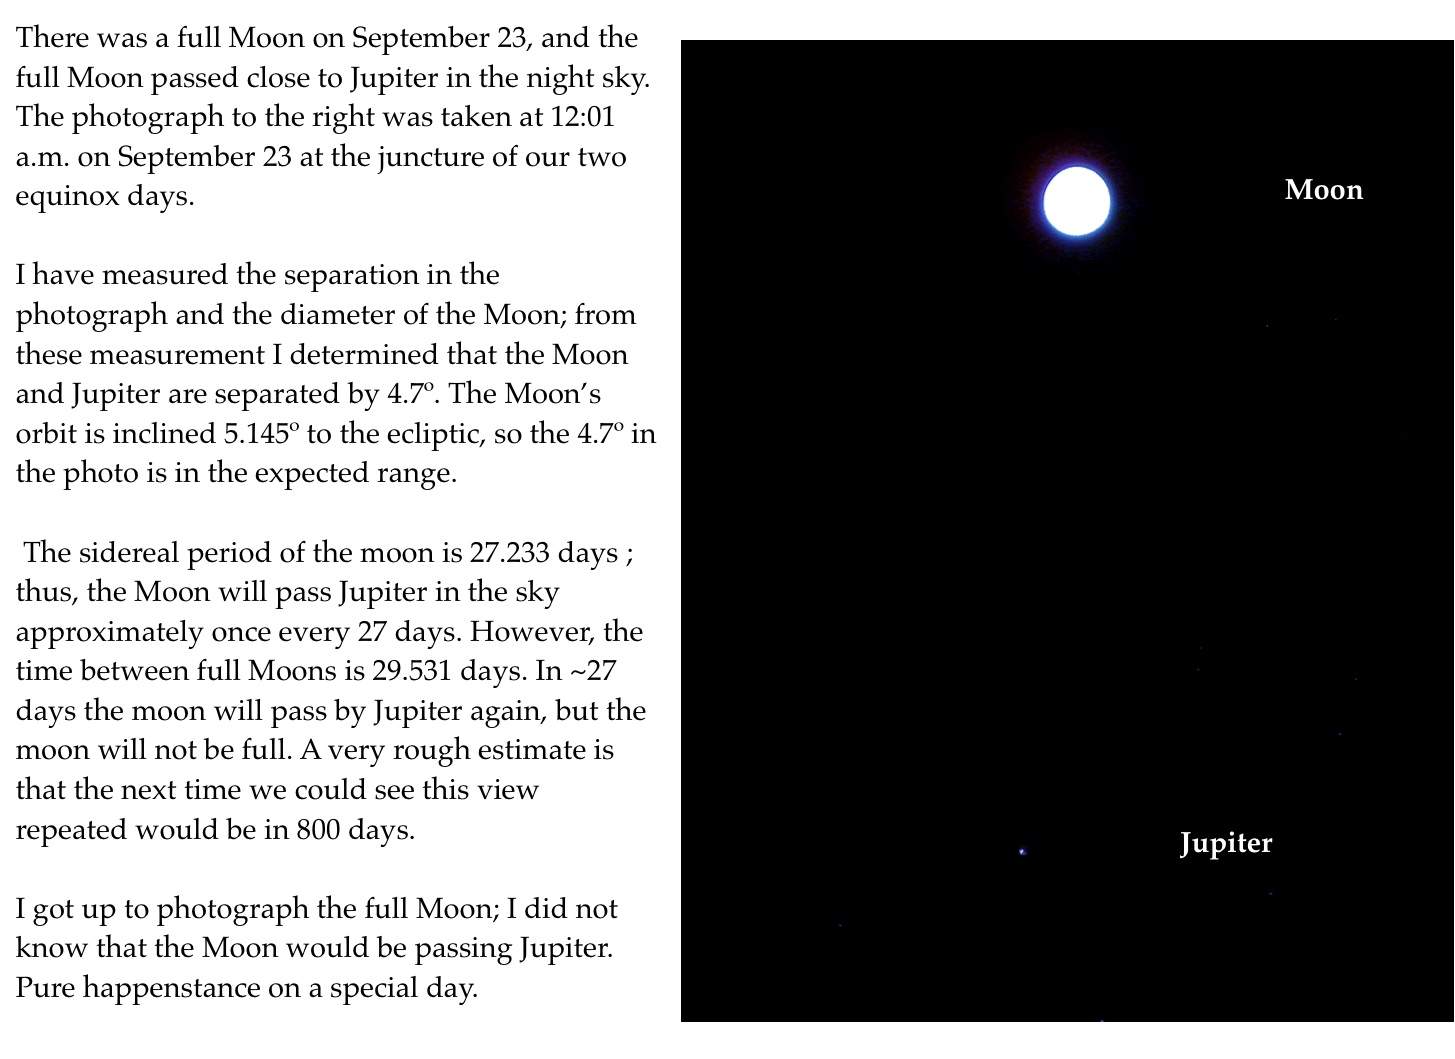
On the evening of September 23, the Gold Hill Inn reopened following the evacuations and the 4-Mile Canyon Fire. We joined the packed house and had dinner. Gold Hill was slowly returning to some semblance of normalcy.
During the entire month of September Gold Hill received 0.06” of measurable precipitation. This rainfall occurred on September 22.
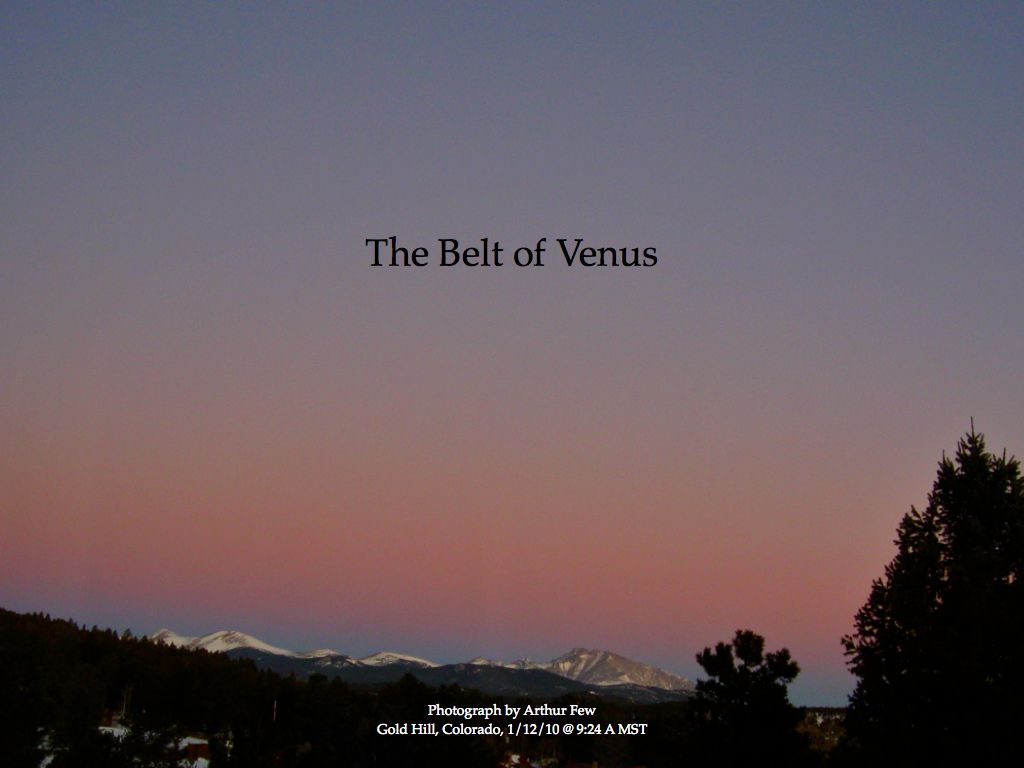
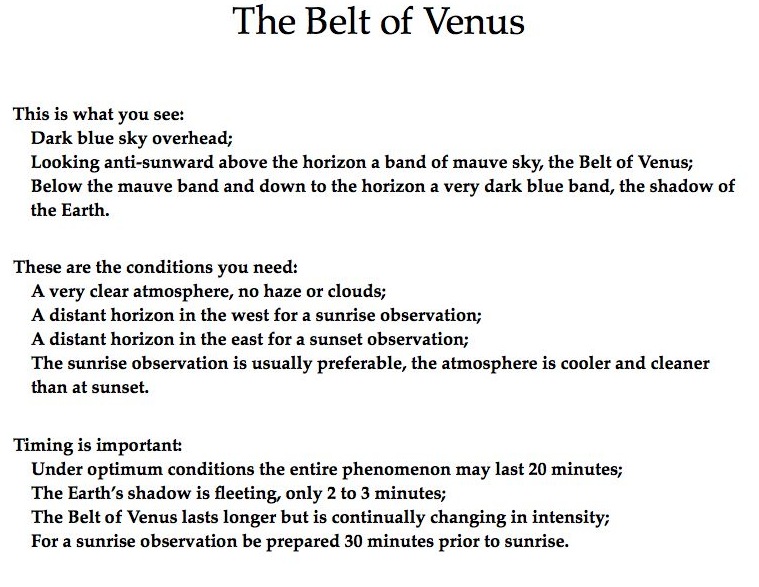
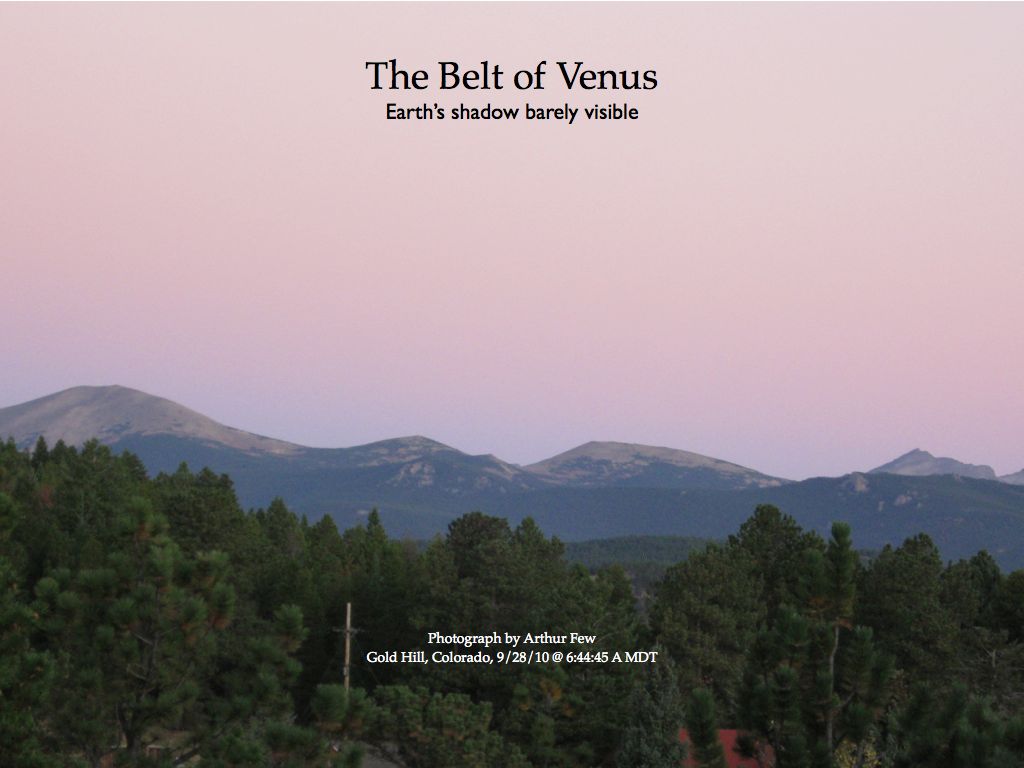
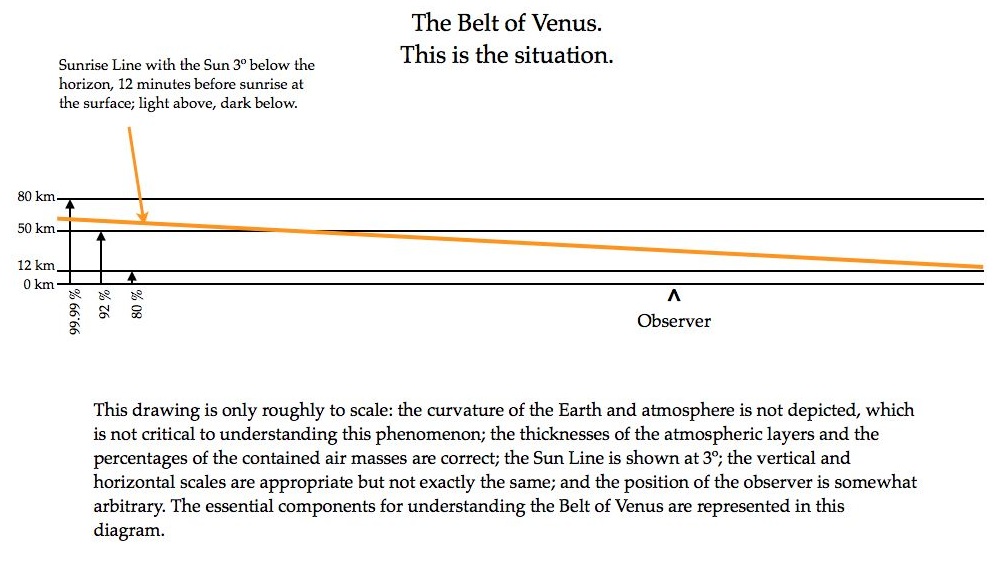
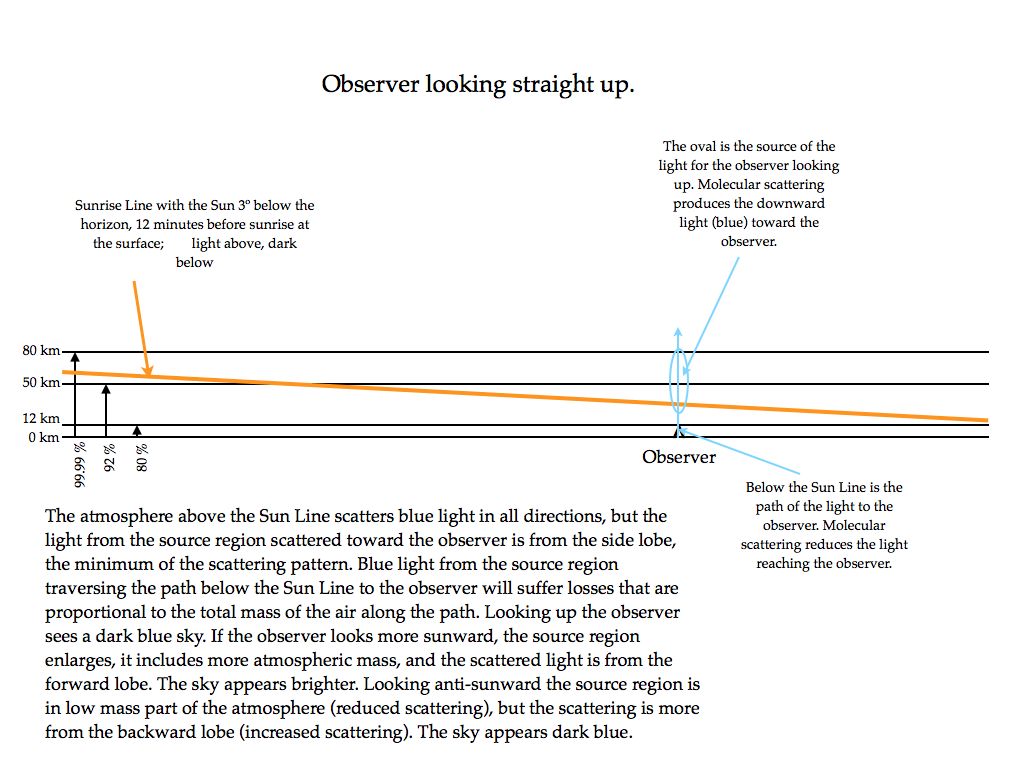
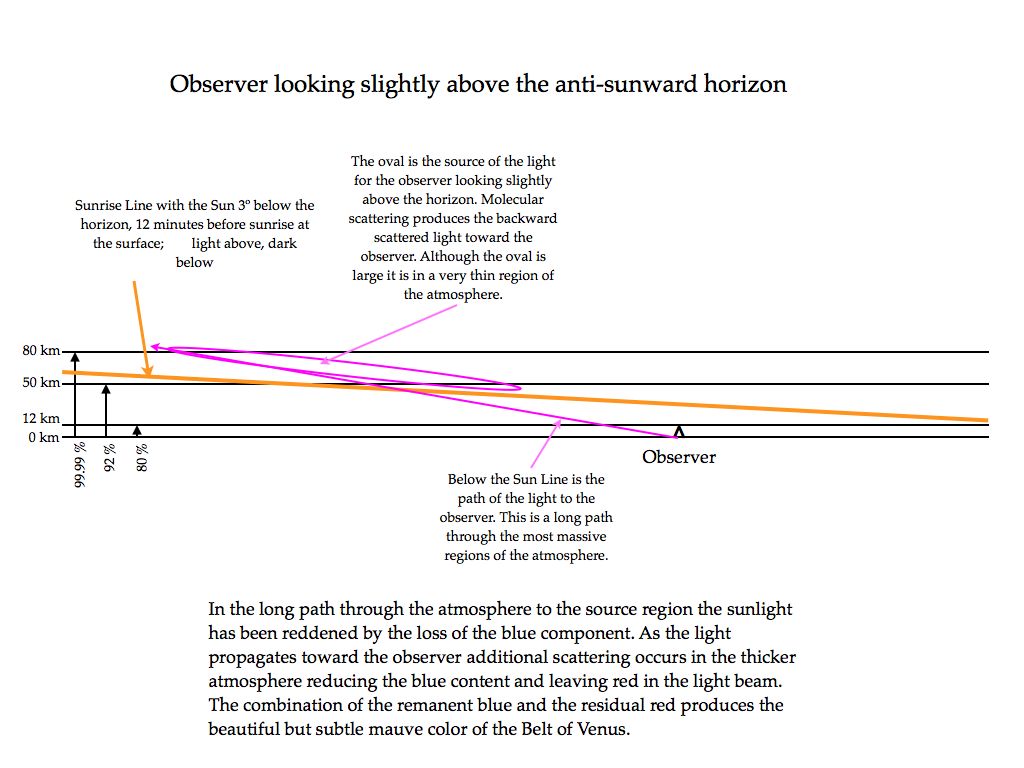
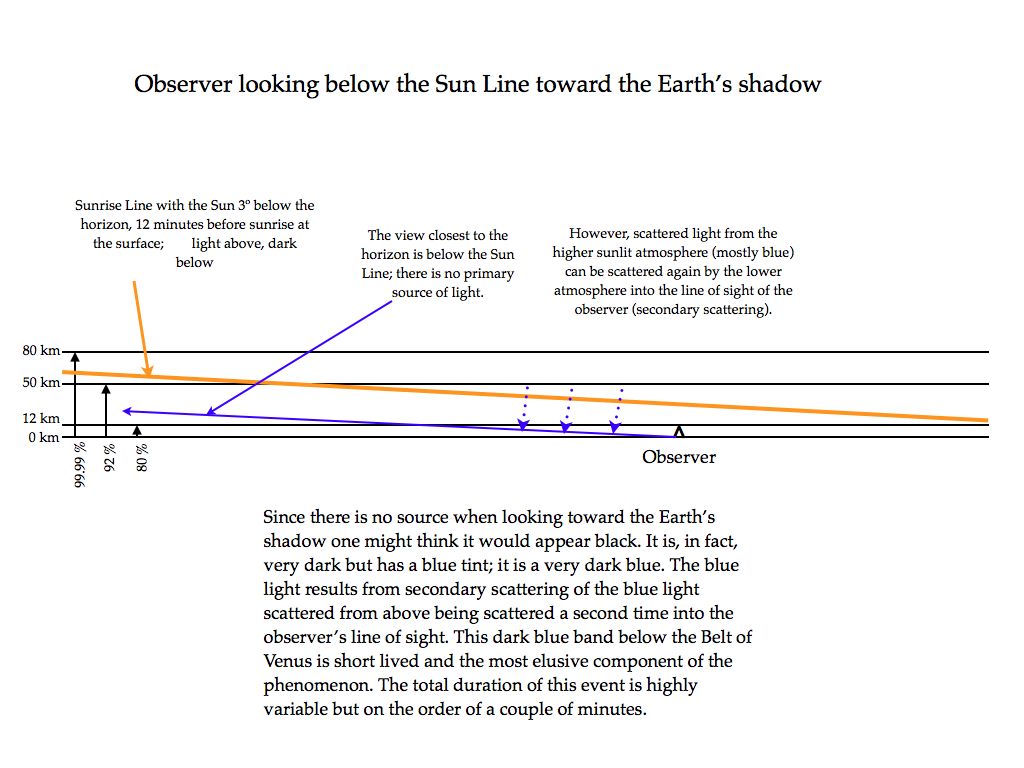
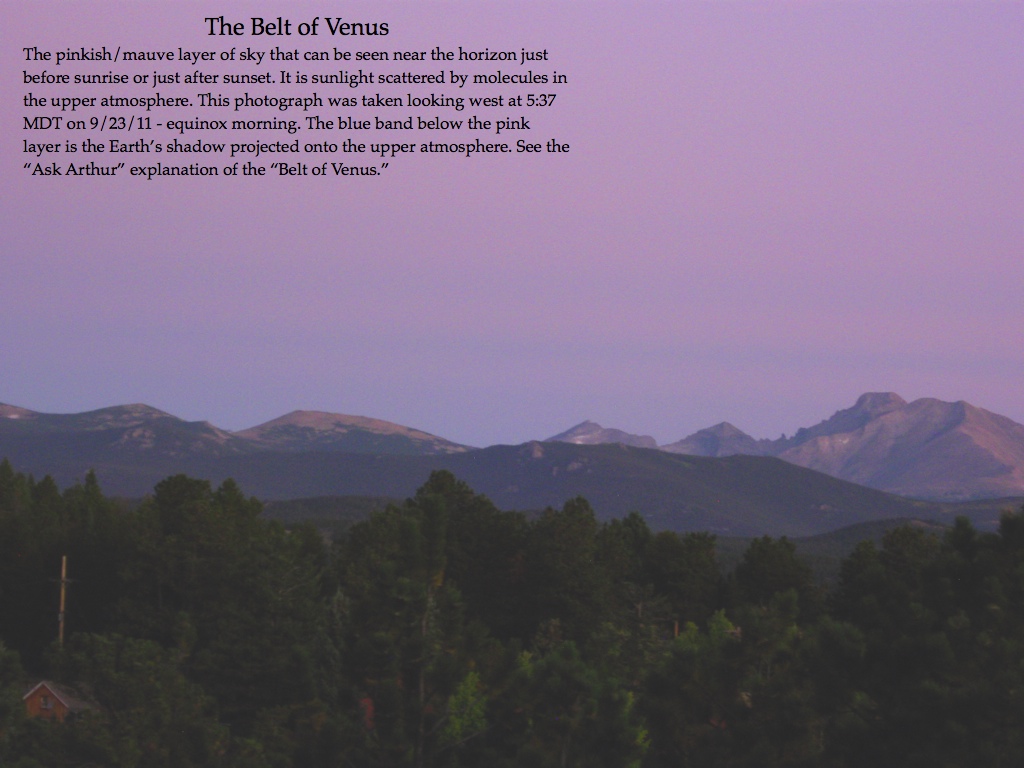
12. The Belt of Venus. Arthur
––––––––––––––––––––––––––––––––––––––
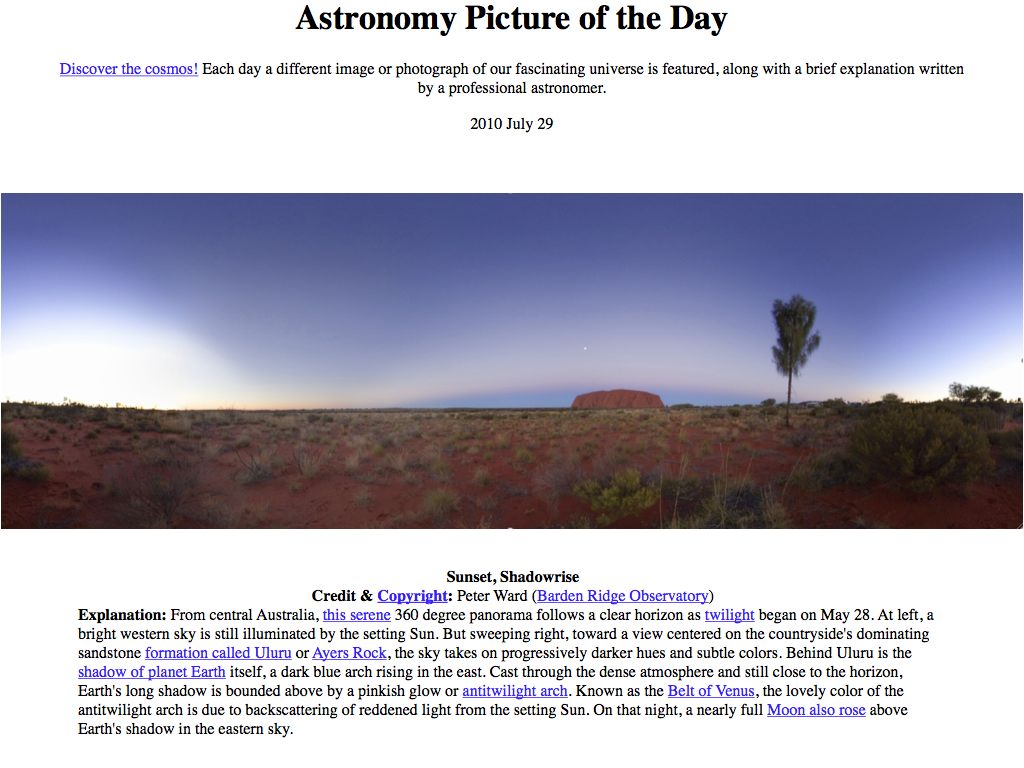
1. There is another feature of the Belt of Venus that we can see in the previous photograph. If you trace the Belt of Venus starting at the anti-sunward point and move to the left you see that it curves along the top of the Earth’s shadow; then when the shadow stops, the Belt of Venus continues along the horizon until the forward scattered sunlight washes it out. The same thing happens tracing to the right. So, although the Earth’s Shadow is limited to the anti-sunward sector, The Belt of Venus extends almost 360º.
2. How did the Belt of Venus get its name? The usual first guess is that Venus is the morning star and the evening star and it never appears too far above the horizon; in this, it is like the Belt of Venus. Good guess but probably not correct. When Venus is the morning star it rises ahead of the Sun, and when it is the evening star it follows the Sun down. Venus is always in the sunward side of the sky and appears near the Sun; it is never in the Belt of Venus. Venus was the Roman goddess who was the equivalent to the Greek goddess Aphrodite. Apparently, Aphrodite had a wide belt of gold given to her by her husband; someone has suggested that Aphrodite’s belt became the “Belt of Venus.” What do you think?
3. Observing the Belt of Venus in Gold Hill. Owing to our topography (Horsfal ridge to the east), we do not have a “distant horizon” to the east, but we have a magnificent distant horizon to the west, the mountains along the continental divide. A good place from which to observe the sunrise Belt of Venus is the Gold Hill marker. Furthermore, we have splendid atmospheric conditions (dry, clear, clean) much of the year especially in the fall. Could one see the sunset Belt of Venus from Horsfal or Big Horn or selected places along Sunshine Canyon Drive where there is a distant horizon to the east? Possibly on a very good day, but the horizon to the east includes Denver, Boulder, etc. with their afternoon haze and pollution, which would obscure the phenomenon.


Photos of the Lunar Eclipse in Gold Hill by Arthur Few

14. Look! What are those sparkly things? Joan
“Diamond dust is a ground-level cloud composed of tiny ice crystals. … Diamond dust generally forms under otherwise clear or nearly clear skies, so it is sometimes referred to as clear-sky precipitation. It is most commonly observed in Antarctica and the Arctic, but it can occur anywhere with a temperature well below freezing. In Polar regions diamond dust may continue for several days without interruption.” … “The depth of the diamond dust layer can vary substantially from as little as 20 to 30 m (66 to 98 ft) to 300 meters (980 ft). Because diamond dust does not always reduce visibility it is often first noticed by the brief flashes caused when the tiny crystals, tumbling through the air, reflect sunlight to your eye. This glittering effect gives the phenomenon its name since it looks like many tiny diamonds are flashing in the air.”
Here in Gold Hill, on Tuesday, February 2, 2011, our temperature was -16ºF at 6:30 a.m.; by 7:45 a.m. it was -22ºF. The following morning at 5:30 a.m. it was -21ºF and stayed there most of the day. We had a period of roughly a day and a half in which the temperature was below -20ºF, the sky was clear, and the sun was shining – ideal conditions for Diamond Dust.
On the Tuesday afternoon I observed tiny ice crystals falling slowly and moving with the very slight breeze. I observed this through a north facing window in the shadow of the house; they were so small you had to look for them; otherwise they would not have been noticed. On Wednesday afternoon Joan called my attention to “sparkling snow” outside the office window. I saw them; this time through a south facing window in the sunshine. They were sparkling; I knew that we had Diamond Dust. I had frequently seen them at the South Pole, Antarctica, but I had not expected to see them in Gold Hill.
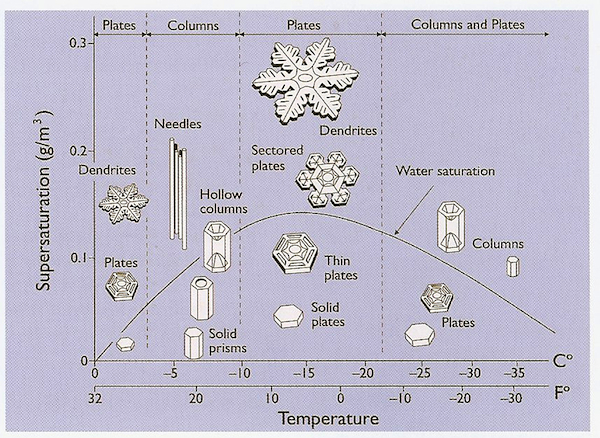
The graphic above is the Morphology Diagram for snowflakes and ice crystals from Ken Libbrecht’s Field Guide to Snowflakes. The horizontal axis displays the temperature in both units of degrees Celsius and Fahrenheit; note that the entire temperature range shown is below freezing. The vertical axis is supersaturation with respect to ice; if you think of the origin at zero on the vertical axis as 100% relative humidity then humidity increases above 100% upward on the diagram (100.1%, etc.). One might think that having relative humidity greater than 100% doesn’t make sense. This happens because it is physically difficult to create a minuscule cloud droplet or ice crystal without the assistance of even smaller “nuclei”, which are extremely small solid particles in the atmosphere; these nuclei form the core of the droplet or crystal, and supersaturation is required to start the growth process.
{Aside: The curved line identified as “Water saturation” is the 100% relativity humidity curve with respect to water. Saturation for water and ice are different; one is a liquid and the other a crystal. In the region below the curve, water vapor is supersaturated with respect to ice but unsaturated with respect to water; hence water vapor will preferentially condense on the ice. Even above the water curve supersaturation for ice is greater than supersaturation for water. When water and ice coexist in a cloud, water vapor will always favor the ice even to the extent that the ice will “steal” water molecules from the water droplets.}
Now examine the far right region of the diagram where the temperature is below -20ºF. In this region, which was the condition we experienced here in Gold Hill on February 2 & 3, 2011, only ice crystals exist. (It was too cold to snow, but that’s another story.) It is the small, solid, simple plates occupying the lower position on the diagram that predominate in this region. Higher humidities are required to produce the more elaborate plates and columns. These simple ice crystal plates are Diamond Dust. In the center and left regions of the diagram, the warmer and more moist regions, we see the development of snowflakes.
Diamond Dust plates are extremely small; the ones in the photographs below are about 0.1 mm (100 microns) across. They would be difficult to see and nearly impossible to photograph were it not for their ability to reflect sunlight. When oriented exactly such that sunlight is reflected from the surface of the plate into the eye or the camera a flash of light is observed. In a situation where many crystals are moving in the air that they occupy; they sparkle. It is somewhat like a swarm of fireflies except much brighter.
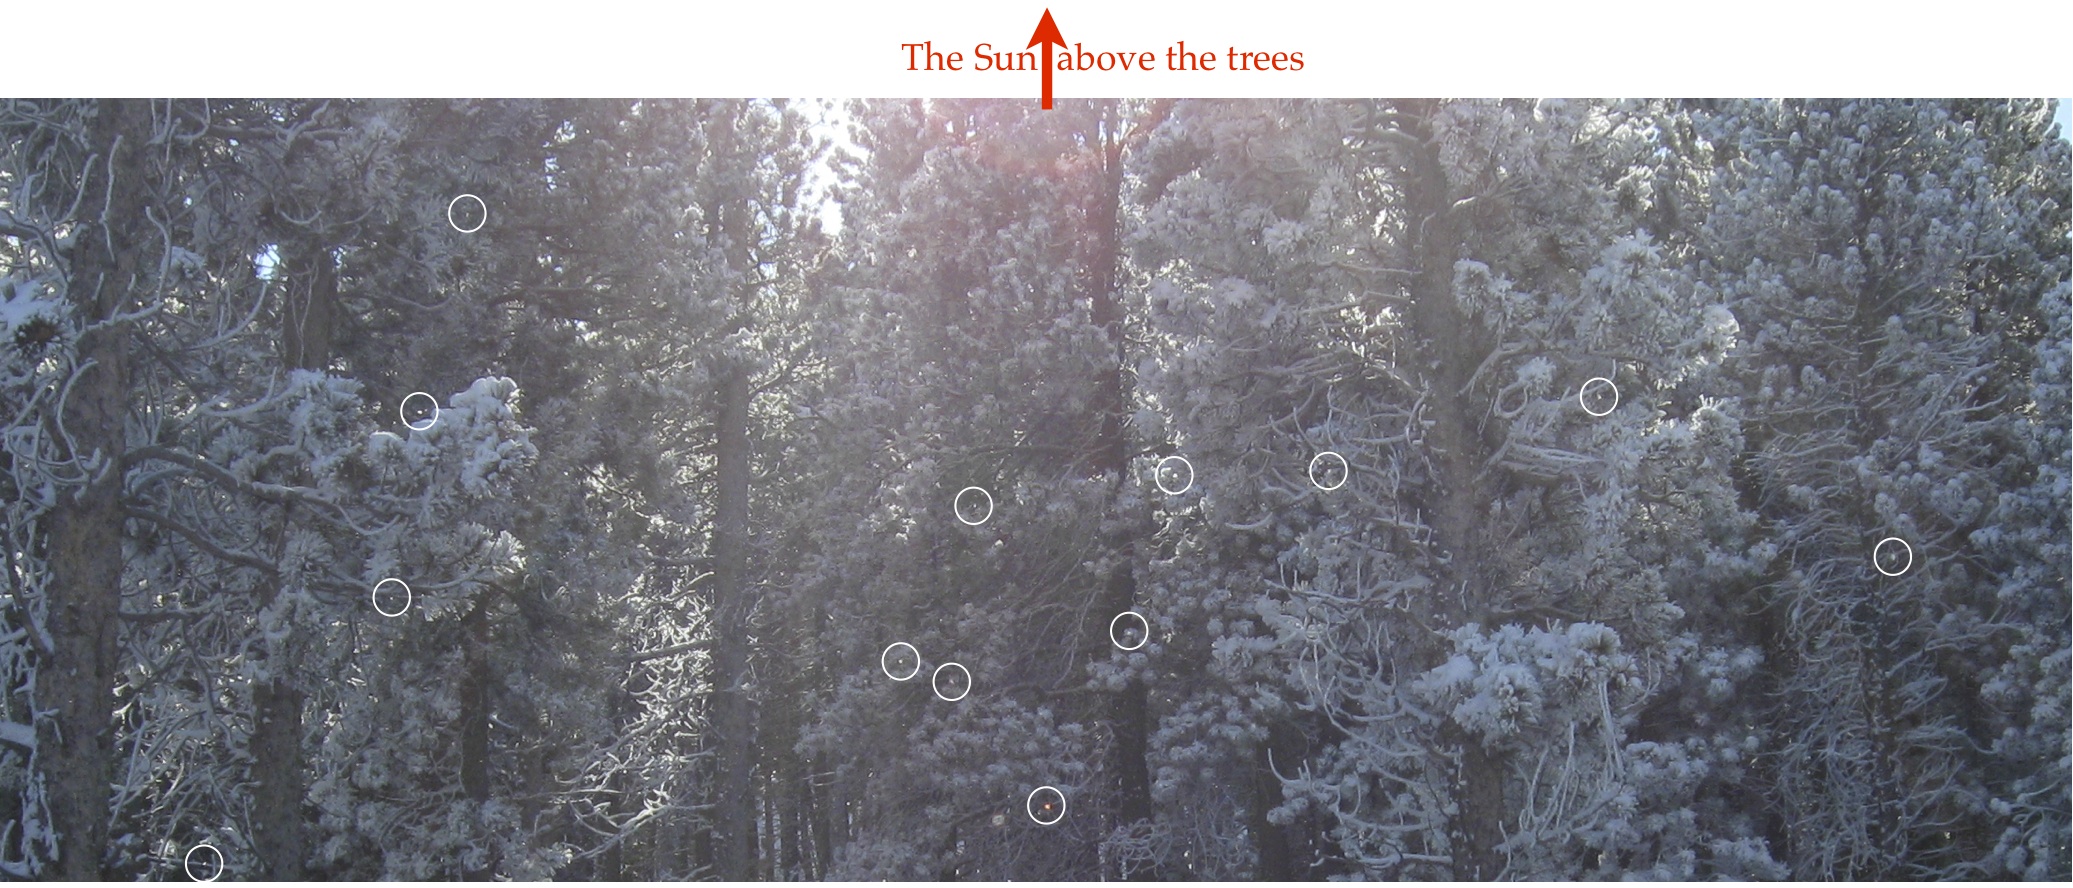
In the photograph above I have placed white circles over bright small spots that are probable Diamond Dust reflections. In making these selections I looked for symmetric bright spots with a uniform dark background. Undoubtedly, there are many more in this photograph that are not circled. For example there are short bright streaks that may be Diamond Dust moving during the exposure. I am sure that you can find many more examples than I have circled. Directly below the Sun near the bottom, the circled bright spot has a red tent; this is probably the interference effect of a double reflection from the top and bottom of the plate. Without knowledge of Diamond Dust would you have ever noticed anything special about this photograph?
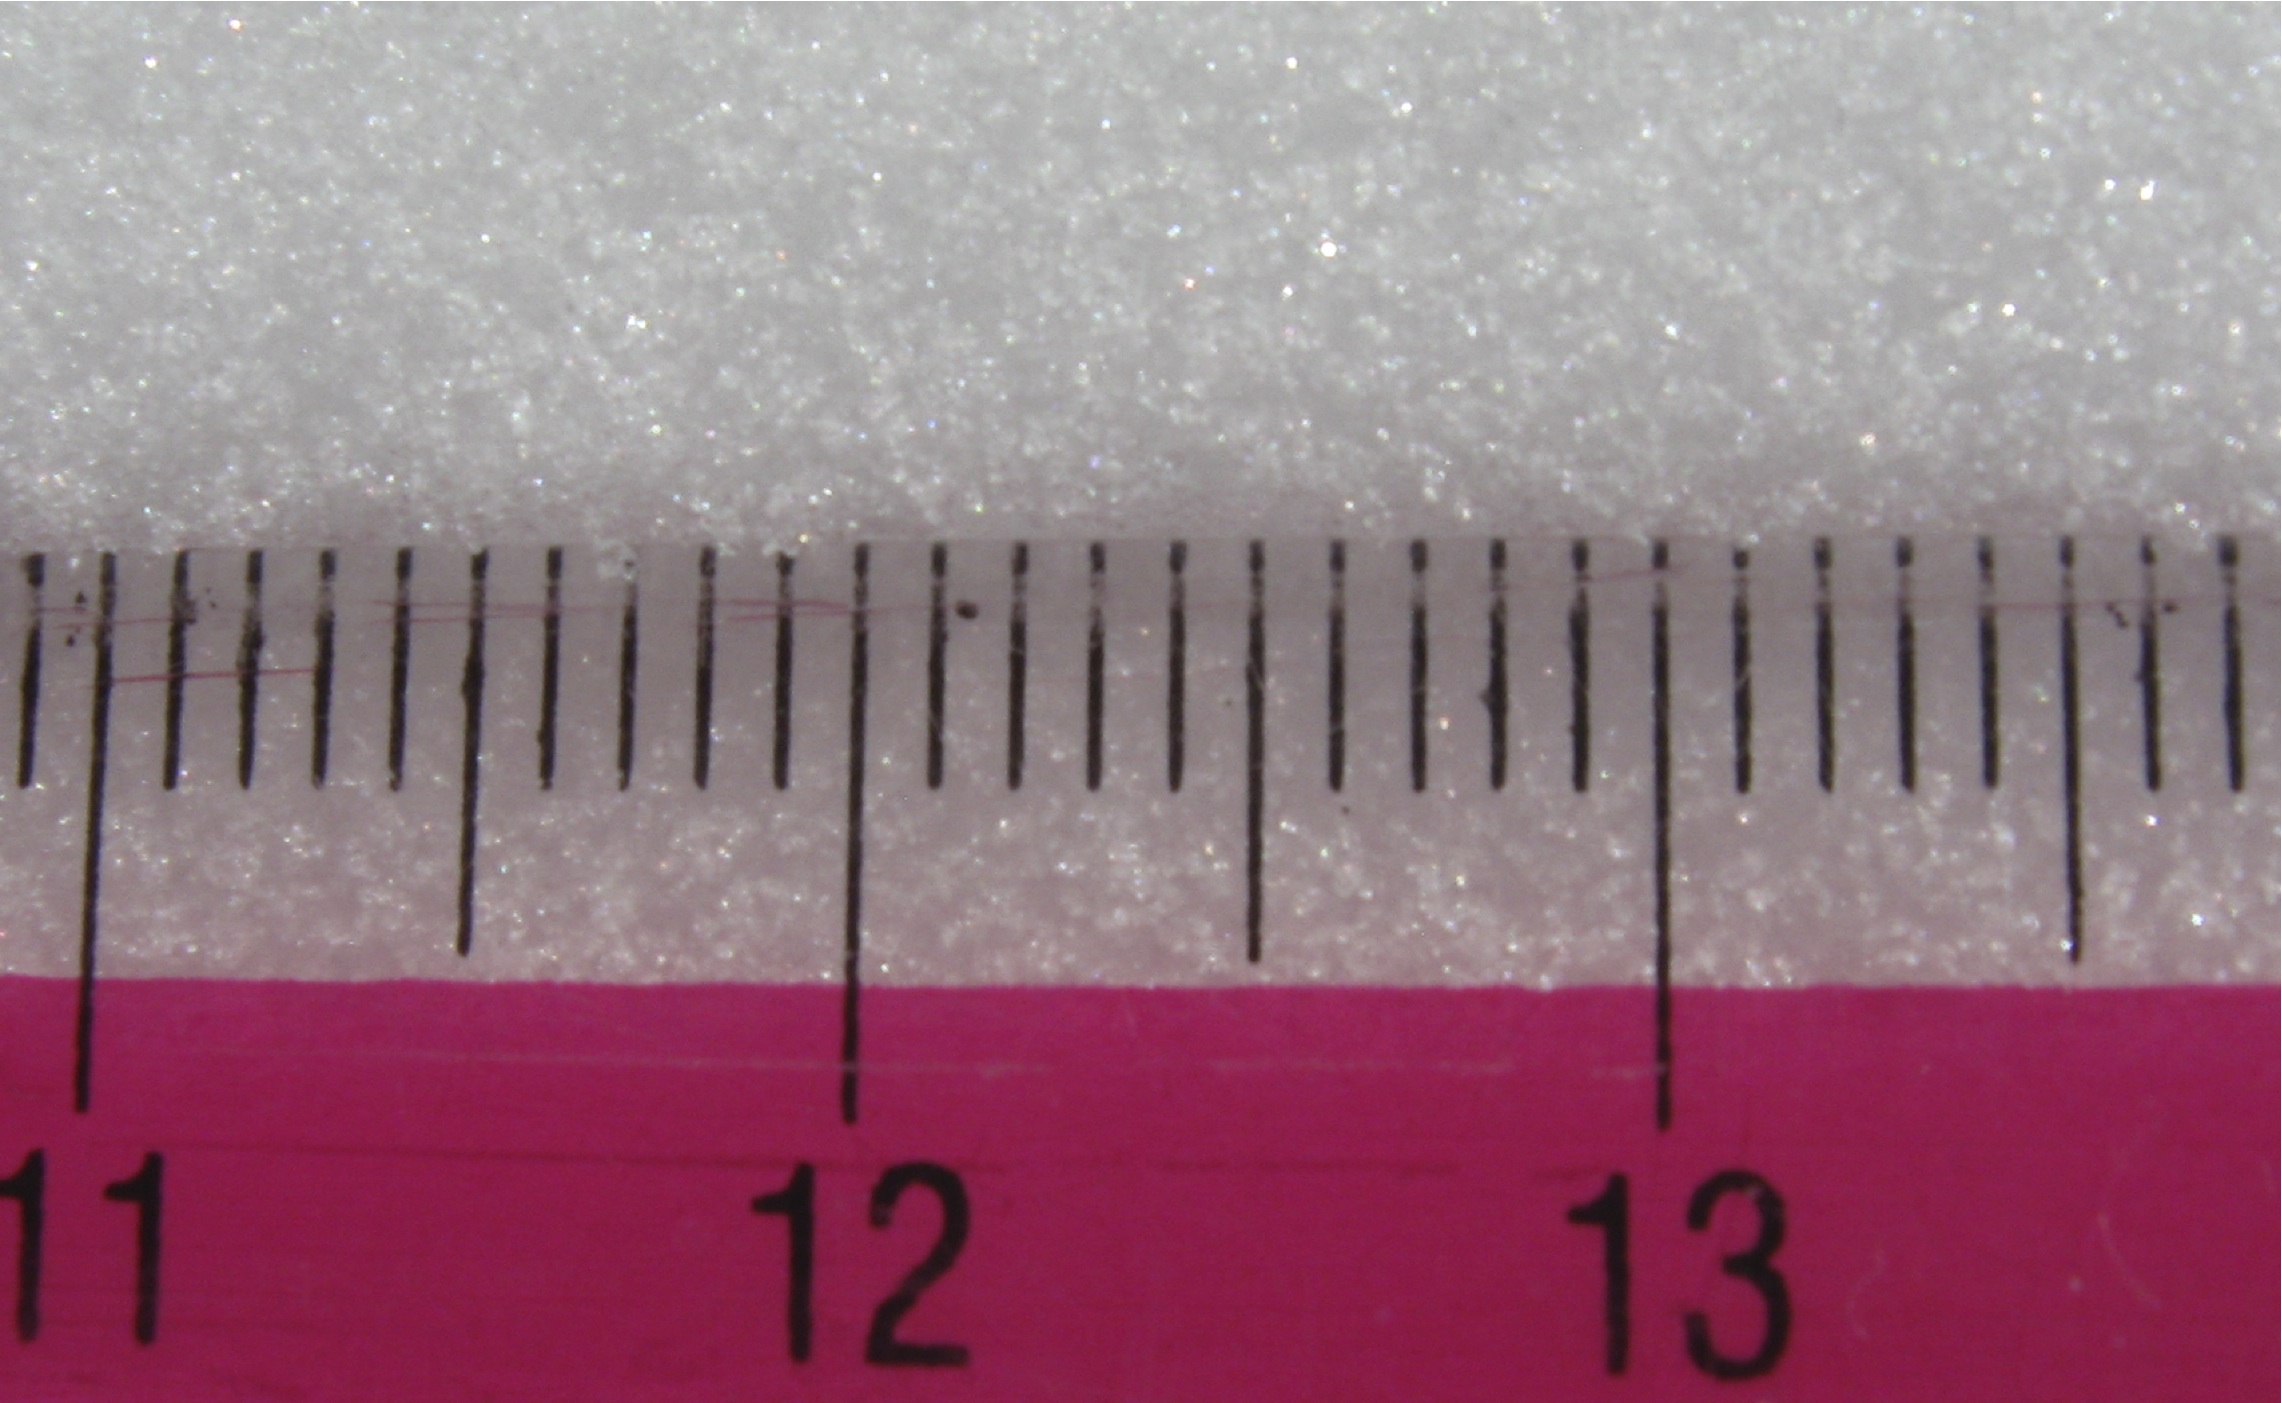
The photograph above is of the Diamond Dust accumulation on the railing of our balcony. The individual ruler marks are spaced 1 mm apart, and the bright Diamond Dust reflections appear to be 0.1 mm across or 100 microns. Looking closely you will also see red and green tinted reflections produced by interference between reflections on the upper and lower sides of the thin plates.
The next time we have: (1) really cold weather, (2) an absence of clouds overhead, (3) sunshine, (4) clean unpolluted air, and (5) what appears to be a thin fog close to the surface; look in the direction toward the Sun but below the Sun and expect to be entertained by Diamond Dust.
15a. I’m not sure why they call this a gravity wave,… Ken
15b. So here’s a guy talking about gravity waves at the sea surface. Are they the same … in the atmosphere? Karen
For atmospheric gravity waves we need to distinguish between the states of “stability” and “instability.” A stable atmosphere does not support vertical motions but suppresses them – there are no updrafts no clouds; whereas, the unstable atmosphere will amplify small vertical motions producing updrafts and downdrafts.
A stable atmosphere is a prerequisite for the formation of atmospheric gravity waves. In a stable atmosphere a parcel of air that is vertically displaced upward from its level finds its density greater than the surrounding air and gravity pulls it back down; it can overshoot and be less dense than the surrounding air and gravity forces it back up. As with the water gravity wave, an atmospheric gravity wave is formed. In most cases we cannot see the atmospheric gravity wave. If, however, the wave occurs in a layer of air nearly saturated with water vapor then it can produce “wave clouds.” See the satellite image below from NASA's Earth Observatory. The cloud part is produced by the crest where the air parcel moves upward and is cooled; the transparent part is the trough where the air parcel is moved downward and is warmed.
In an unstable atmosphere an air parcel displaced upward is in an environment of greater density and thus experiences an upward force of gravity. If displaced downward it is more dense than the surrounding air and experiences a downward gravitational force. Thus any displacement of an atmospheric parcel produces an amplified effect – convection, clouds, etc.
In the satellite image below, we can see both conditions. The satellite is over the Indian Ocean; in the upper part we see tops of convective clouds and in the middle section we see atmospheric gravity waves. Most probably the convective clouds are over land or warm surface water where the surface heating promotes instability. Over the ocean the air is cooler and stable. As the wind flowing left to right passes over a small volcanic island gravity waves are generated, which downwind become wave clouds and visible for very long distances downwind of the island. Note that at the overlapping margins of the two types of clouds the lower atmosphere is unstable producing convective clouds and above that a stable region exhibits wave clouds.

Gravity waves are interesting wherever they occur, whether we can see them or not. See also the “Ask Arthur” discussion of tsunamis – the ultimate expression of gravity waves.
Hard to believe, but when I completed the comments above Joan and I walked down to the mailbox and on the way we saw the most fantastic display of high altitude wave clouds. By the time I got home a got my camera they had significantly changed but there remained a good display, which I photographed at 3:51 p.m. See below. There was a telephone message from Ken telling me to go outside and look at the clouds.
The wave clouds that we saw ~ 30 minutes earlier were bright white and covered whole visible sky above us; mixed in with the wave clouds were some very small cumulus structures. The wave features were much smaller than the ones in these photos. Karen observed them down in Boulder, and I suspect that they could have been seen over our local part of the Front Range. If you are reading this and know someone that has a photograph of the earlier wave clouds, please ask them to send me a copy <few@rice.edu>.


Compare these photographs with the NASA image near the beginning of the response.
Meteorological balloons (radiosondes) are launched by the NWS in Denver at 6 a.m. and 6 p.m. MDT daily to obtain upper air data. The wave-cloud event (3/23/11) here in Gold Hill was essentially over by 4 p.m., so the 6 p.m. radiosonde is the closest sounding to our event.
The diagram below is called a “Skew T - ln p” chart; this chart is a useful and powerful tool in understanding details of atmospheric structure, but a complete understanding is beyond the scope of what we need to analyze the wave cloud event. First, the “ln p” refers to the vertical axis on the left. The numbers (900 - 100) are the pressures in hectopascals (= millibars) at the atmospheric levels indicated by the horizontal blue lines. You will note that the numbers are not evenly spaced; they are logarithmically spaced. To the right of the vertical axis are numbers giving the approximate heights in meters of pressure levels. Example; in the oval: the 500 hP level is 5620 meters above sea level in the standard (~ average) atmosphere.
Now note that there are no vertical lines on the chart; they are replaced by straight blue lines of constant temperature, which are “skewed” by 45º. Example; the red diagonal line is the 0º C temperature line.
There are curved lines for: “dry adiabatic processes” (= curved green), “wet adiabatic processes, inside clouds” (= curved blue).
There are straight lines = “mixing ratio, which are the measure of water content” (= diagonal magenta).
All of the lines described above are part of the chart format and do not reflect measured atmospheric properties. There are two heavy black lines representing the radiosonde-measured values of temperature (= right line) and the dew point temperature (= left line). At a given level the air is dry when these lines are widely separated and moist when close together.
I have constructed two orange boxes around the temperature curves. The lower box between 800 hP and ~ 650 hP is dry. Now compare the temperature line with the nearby green (= dry adiabatic lines); they are parallel; therefore, in this region the air is cloud free and in convective motion. The dew point temperature line in this region is parallel to the magenta mixing ratio lines; this is consistent with dry convective processes.
In the smaller orange rectangle above the convective region conditions are different. The temperature line is now parallel to the wet adiabatic curves (= curved blue lines) and the dew point curve shows decreasing water vapor with altitude. Both of these characteristics indicate convection in clouds, but their separation does not indicate present saturation of the air. What we can conclude from this profile is that this layer of air was previously inside a cloud but has moved horizontally and dried somewhat. Remarkably, the temperature profile has “remembered” its past life in the cloud! This “memory or imprinting” happens frequently in the atmosphere when the flow is predominately horizontal. I have seen cases of dry air layers over the U. S. with wet adiabatic profiles, and the air layer can be traced back to tropical storms in the Pacific.
There is a very special “nose shaped” feature in the maroon circle above the small orange box. Upon close inspection we see that the temperature increases with altitude; this is an inversion layer, and it is super stable. Note that above this inversion layer the air is extremely dry; the inversion prevents moisture from below reaching the air above.

I think that we may conclude with some certainty that wave clouds we observed on 3/23/11 around 3-4 p.m. were in the atmospheric layer delineated by the smaller orange box in the above Skew T - ln p chart. This layer is stable for dry processes and can support gravity waves. I have also noted along the left vertical axis the altitude of Denver, Gold Hill, and Longs Peak. I think our wave clouds may have been initiated by Longs Peak in the same way that the wave clouds in the first image above were initiated by the volcanic island.
Along the right vertical axis you will see a series of wind vectors; these are derived from the tracking information for the radiosonde. These measurements provide essential information about the speed and direction of the air parcels sampled by the radiosonde. When the wind information from this radiosonde is merged with the wind information of all of the other radiosondes launched at the same time a fairly complete picture of the atmospheric flow can be derived. In the map below all of the radiosonde launching sites in the contiguous U.S are displayed.

The map below gives us the atmospheric flow
at the 500hP level in the atmosphere. This is
higher than the layer of the wave clouds of
interest; however, it gives us a good idea of the
connectedness of the parcels of air. In general
Gold Hill is downwind of Longs Peak and other
peaks along the continental divide. Although the
“jet stream” is higher than the 500 hP flow shown
below, the shape of the flow here is similar to
the jet stream, which is above the 300 hP level.

16. Full perigee
Moon and the vernal equinox: discussions
at Donal’s St. Pat’s party, 3/19/11, and the
Sand’s soup dinner, 3/20/11; also Kris’s
question, 2/1/10, regarding the full Moon’s
LARGENESS.
Full Perigee Moon (3/19/11) and Equinox (3/20/11)
Two important events occurred back to back March 19 and 20, 2011.
Full Perigee Moon. The joint occurrence of a full Moon (every 29.53 days) and lunar perigee (every 27.32 days) can happen on the same day approximately every 806.76 days or ~ 2.2 years. The close juxtaposition (~ one hour apart) of these events that occurred March 19 – Full Perigee Moon – only happens every 18 years or so. Perigee is the position in the moon’s orbit that is nearest the Earth (363,104 km); apogee is the position farthest from the Earth (405,696 km).
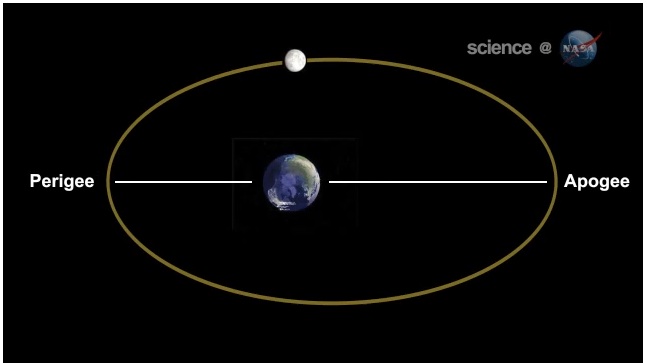
The apparent
size of the moon as seen from the Earth is
larger at perigee, when it is closest, than when
at apogee when it is farthest. It also appears
slightly brighter at perigee.
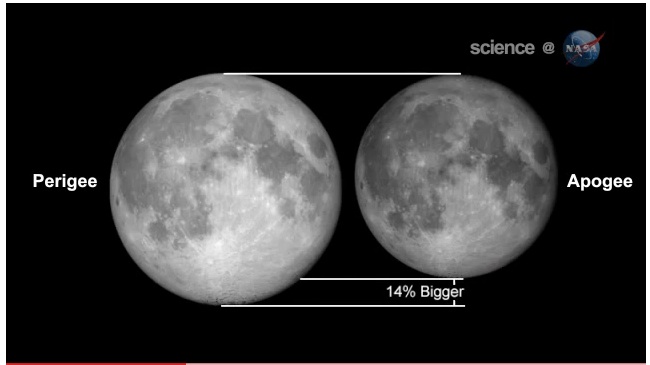
The two figures
above are from the Science @ NASA website:
http://science.nasa.gov/science-news/science-at-nasa/2011/16mar_supermoon/
There is
another aspect of the “human-observed” apparent
size of the Moon that is not confirmed by
instruments and is not related the distance from
Earth to Moon; this is referred to as the Moon
illusion. This will be discussed at the end of
this response.
http://science.nasa.gov/science-news/science-at-nasa/2005/20jun_moonillusion/
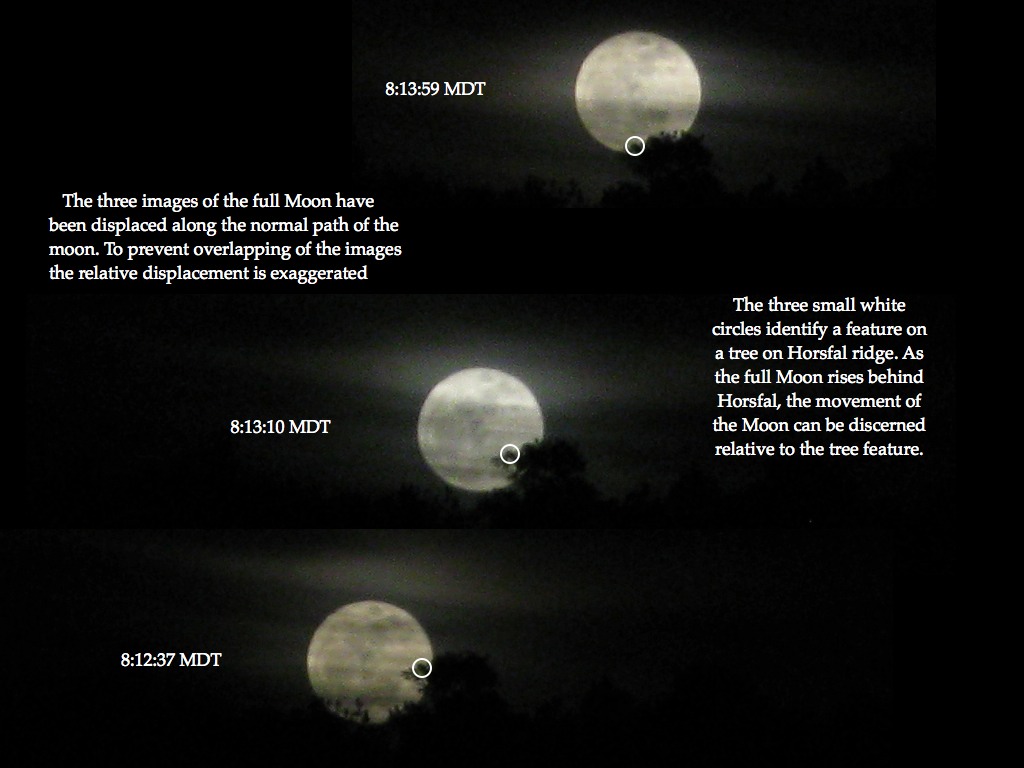
Around 7:30
p.m. on March 19, I set up my tripod and camera
at the edge of the town meadow behind the Wilder
house and waited for the Moon to rise above
Horsfal Ridge. There were several thin clouds
partially obscuring the image of the Moon but
they just added to the special allure of the
event. Three of the photos taken at the times
shown to the left of the images were combined in
the figure below. Although in the figure the
images appear to be widely separated, in fact
they would overlap had I not displaced the
images along the path of the rising Moon. If you
examine the feature on the tree on Horsfal ridge
that is identified by the small white circles
you will note that in the 1 minute and 22
seconds time lapse during which these photos
were taken the Moon advances by less than half
of its diameter.
There is one
other property of the changing apparent size of
the Moon that produces rather spectacular
results; this occurs during a total solar
eclipse. The angular size of the Sun and Moon
viewed from the Earth are nearly the same;
however, the 14% change in the apparent size of
the Moon between perigee and apogee can make a
substantial change in the view that we get of
the Sun when eclipsed. The first photo below
shows the total eclipse of the Sun when the Moon
is near perigee; The apparent size of the Moon
is large, and it completely covers the solar
disk. When the disk is covered we can see the
magnificent solar corona extending outward into
space and dragging the solar magnetic field with
it. The solar corona is a magnetized plasma and
flows outward as the solar wind passing the
Earth and continuing into the far reaches of the
solar system and perhaps beyond.
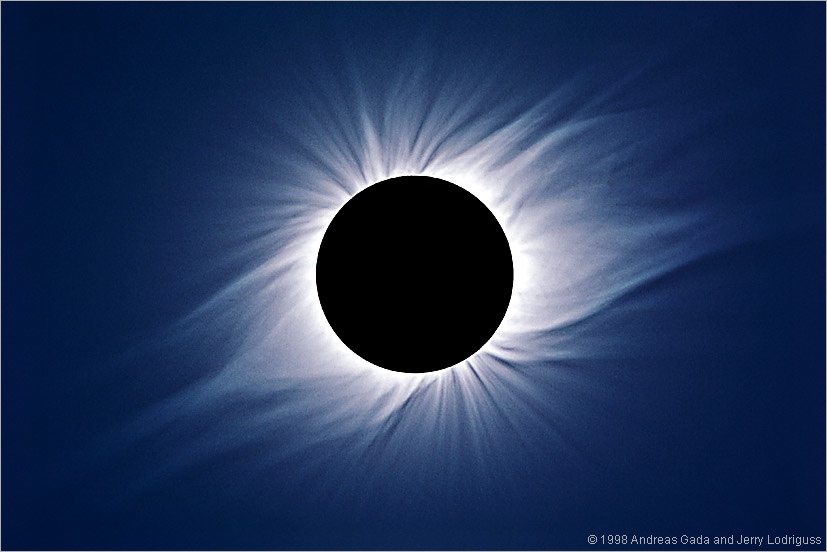
Web source of this photo <http://www.astropix.com/HTML/SHOWCASE/TOTAL1.HTM>.
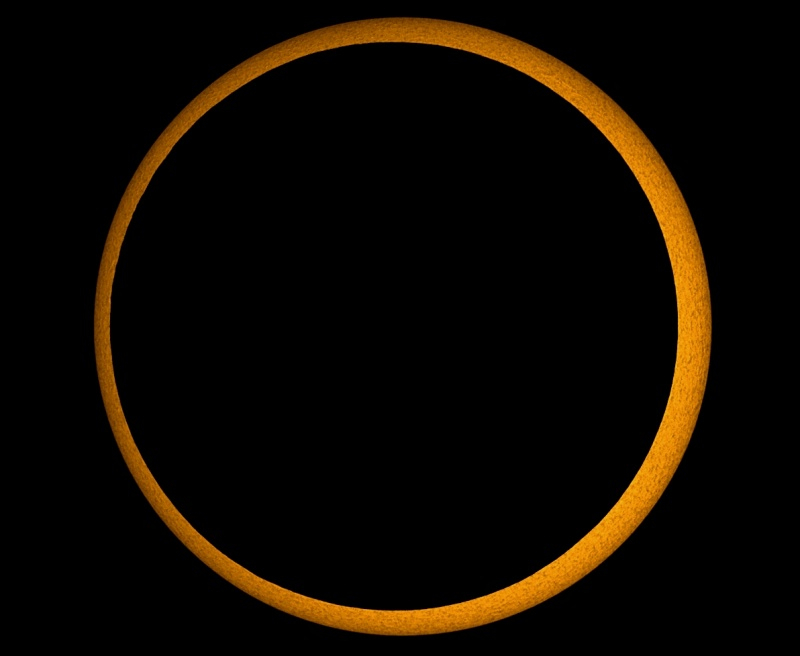
When a solar
eclipse occurs and the moon is near apogee, the
apparent size of the Moon is smaller and it does
not completely cover the solar disk; this is an
annular eclipse. We can see this in the
next photograph; the corona cannot be seen
because the exposed disk is much too bright. The
exposed rim of the sun is filtered to prevent
overexposure. <http://antwrp.gsfc.nasa.gov/apod/ap100122.html>
The Moon
Illusion
We now return to a subject mentioned above, the Moon illusion. I think that we have all observed this at one time or another, or perhaps many times! The Moon (Sun) is rising (setting) and it appears to be unusually large. I am amazed by the effort that has been expended trying to explain this observation when a simple photograph comparison should satisfy everyone. (One web site is 16 pages in length; mostly garbage.) Nonetheless, when you experience the Moon illusion you will probably not want to accept my simple explanation. A compact discussion can be found at <http://en.wikipedia.org/wiki/Moon_illusion>.
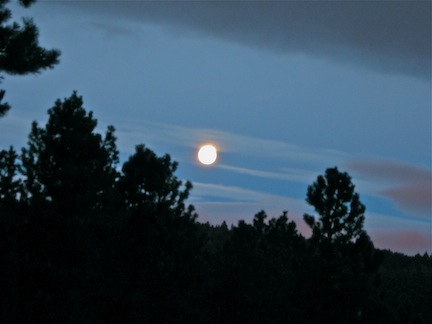
As the name suggests it is an illusion. When you look at the moon when it is up in the sky with only a few bright stars around, your brain tells you that it is way out in space orbiting the Earth. When you see the Moon rising (setting) among familiar objects on the horizon your brain tells you that the moon is nearby; therefore it must appear larger. I frequently see the Moon through trees behind our house and the Moon seen between the branches appears larger than the Moon alone in the clear sky. See; my mind tricks me too.
The photo below of the full Moon setting was taken from our patio on Sunday, January 11, 2009, at 7:21 a.m. The Moon is near the horizon and in the midst of trees and thin clouds.
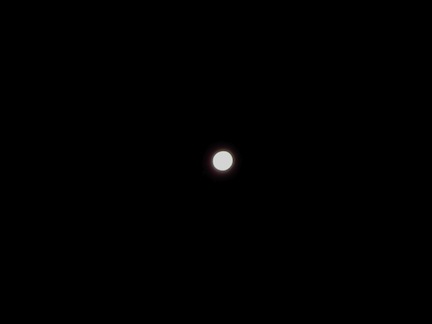
The next photo
is the same full Moon, but this time the Moon is
higher in the sky. This photo was taken on
Saturday, January 10, 2009 at 5:25 a.m.; one day
before the photo above.
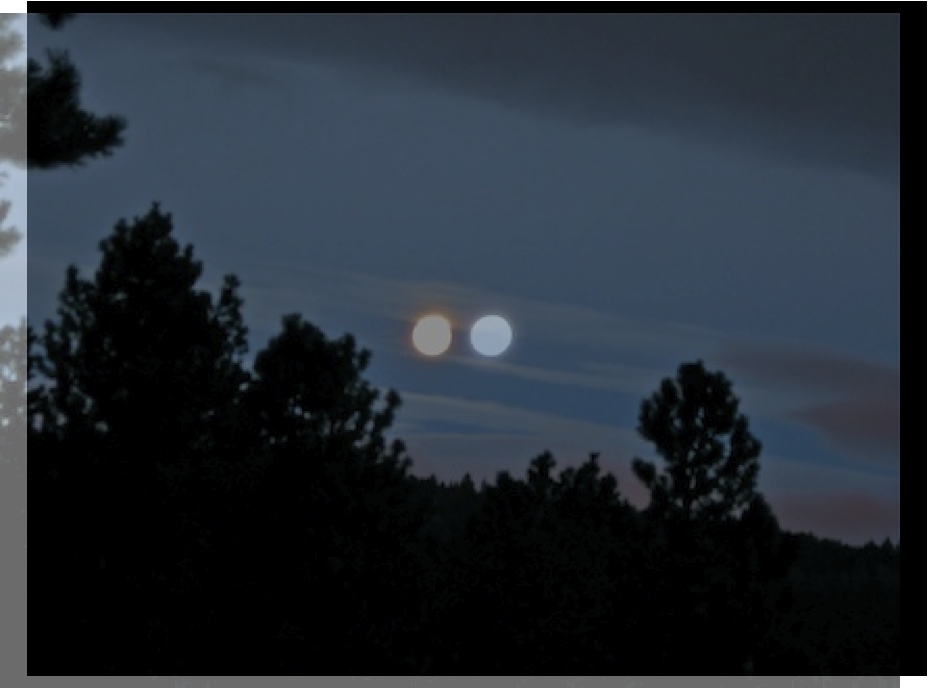
You might
notice that the setting Moon appears larger than
the “sky” Moon. If seen in person, rather than
in photos, the apparent difference is greater.
In the composite image below I have moved the
“sky” Moon image down beside the setting Moon.
In this view the apparent difference in size
vanishes.
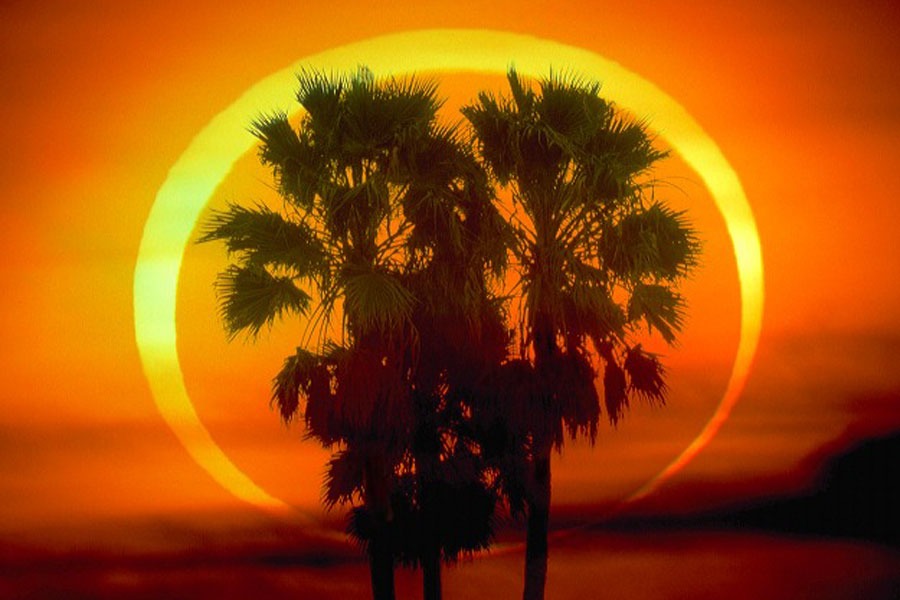
The photo below
brings into view the above discussion of
apparent Moon size in its orbit, the effect of
apparent Moon size on eclipses, and the Moon
illusion all in one photo. Here we have an
annular eclipse of the Sun as the Sun and Moon
are setting behind palm trees in January
1992. <http://apod.nasa.gov/apod/ap090125.html>
The flattening (shrinking in the vertical) of
the moon and eclipsed Sun is an atmospheric
effect.
Spring (Vernal)
Equinox 2011
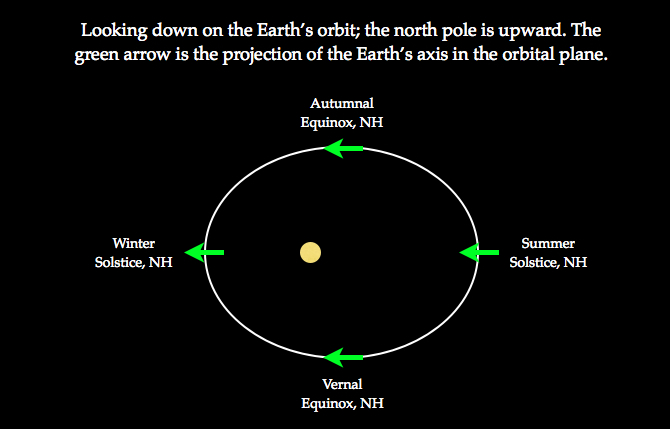
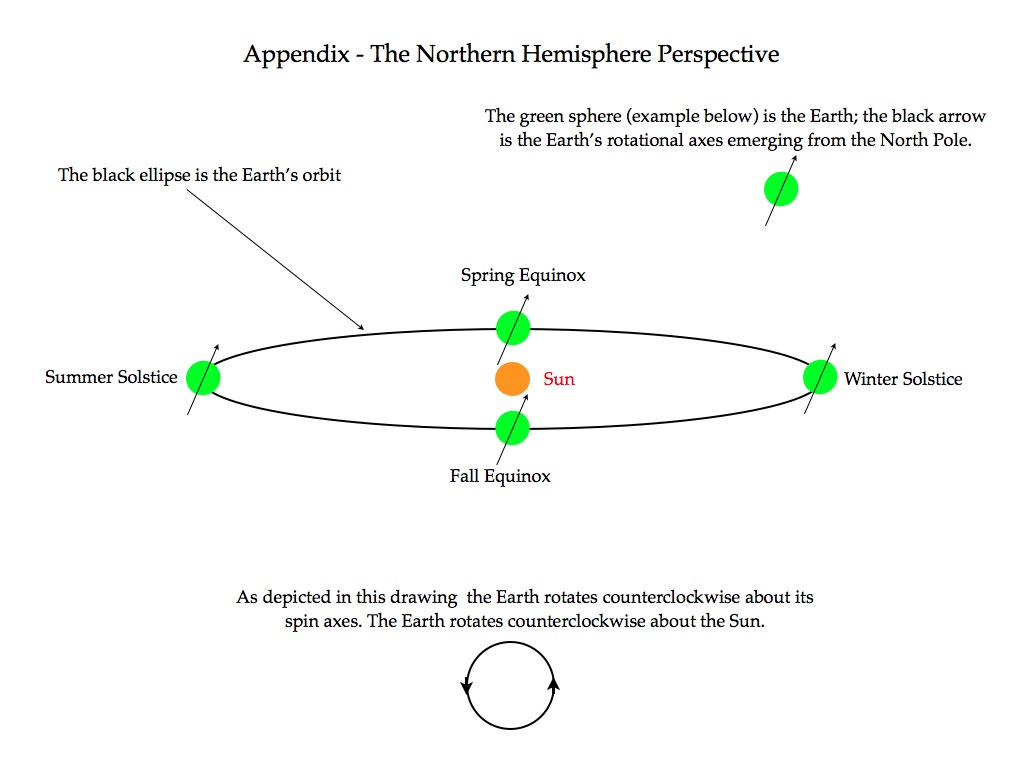
The equinoxes (there are two equinoxes each year) are defined as the moments during the year when the projection of the Earth’s rotational axis onto the orbital plane is parallel to the orbital path itself. The other two significant events in the solar year, the summer and winter solstices, correspond to the moments when the projection of Earth’s axis is perpendicular to the orbit.
Other common descriptors of the equinoxes are (1) the Sun crosses the Equator and (2) the length of the day and night are equal. These are not exactly correct. The Sun crosses the Equator at the exact moment of the equinox only at the longitude where it is local noon at the time of the equinox. The length of day and night are functions of latitude, longitude and topography; equal day and night usually occur within a couple of days of the equinox but not necessarily on the equinox.
You may have noticed in the diagram above that in northern hemisphere (NH) winter the Earth is closer to the Sun; at this time it is southern hemisphere (SH) summer, so is the SH summer warmer than NH summer? Another consideration is the speed of the Earth in its orbit; the closer to the Sun the faster the Earth moves. The two effects exactly compensate for each other (Newton’s 3rd law). In SH summer the Earth is closer to the Sun, but it is moving faster, so summer is shorter.
Vernal
Equinox, 2011, occurred on March 20 at 23:21 UT
(11:21 p.m. UT) or 17:21 MDT (5:21 p.m. MDT).
The nearest sunrise to the equinox was at 7:07
a.m. MDT on the 20th, and I wanted to photograph
the equinox sunrise over Horsfal Ridge as I had
the Moon on the night before. In my “Ask Arthur”
response regarding the 2010 fall equinox (#10)
above, I explained how the Labor Day 4-mile
wildfire of 6 September, 2010, had opened a gap
in the forest between our patio and the equinox
sunrise position on Horsfal Ridge. The morning
of March 20 we had thin clouds as we had the
night before for Moon rise, but the morning
clouds were thicker and the forward scattering
of the sunlight was much more intense.
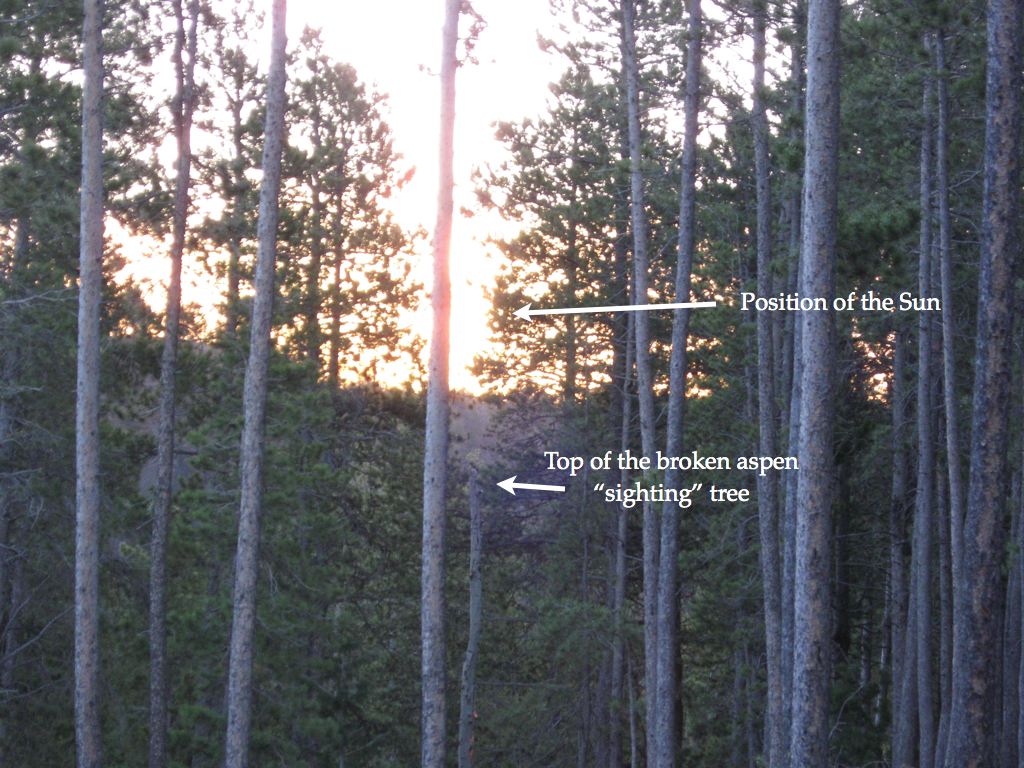
Nonetheless, in the photograph below taken at
7:10 a.m. MDT, the position of the Sun can be
roughly determined near the center of the
brightly illuminated cloud. At 7:10 a.m. the Sun
is slightly above Horsfal Ridge; horizon sunrise
was at 7:07 a.m. As explained in the fall
equinox response the sighting tree is a
fortunate happenstance.
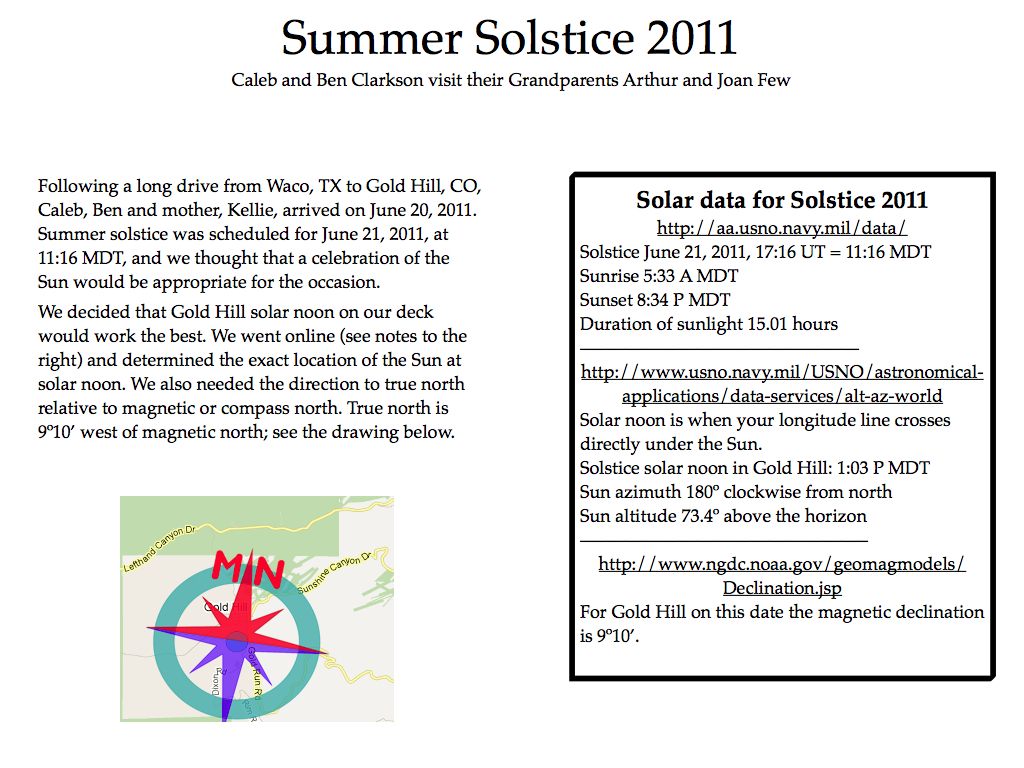
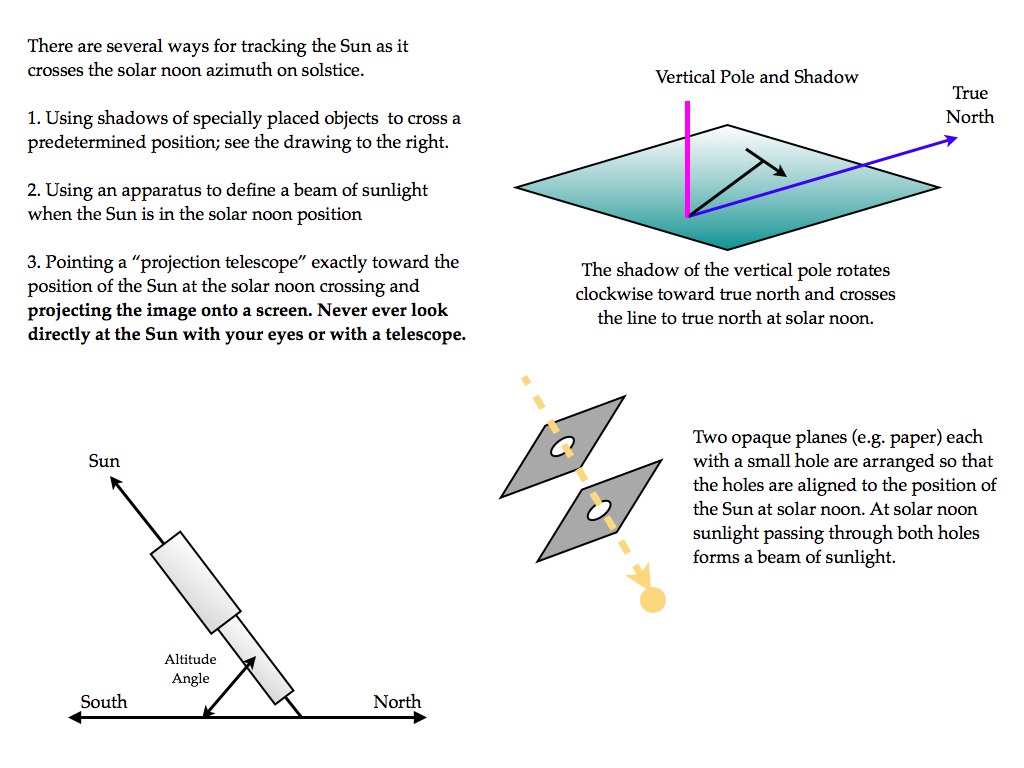
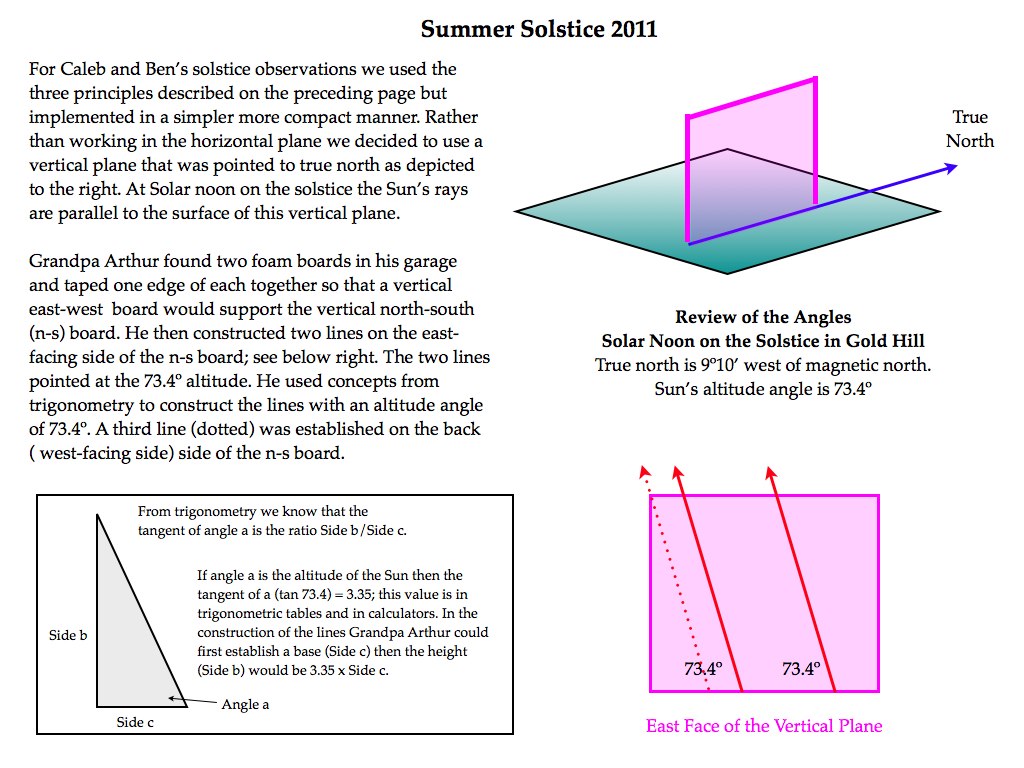
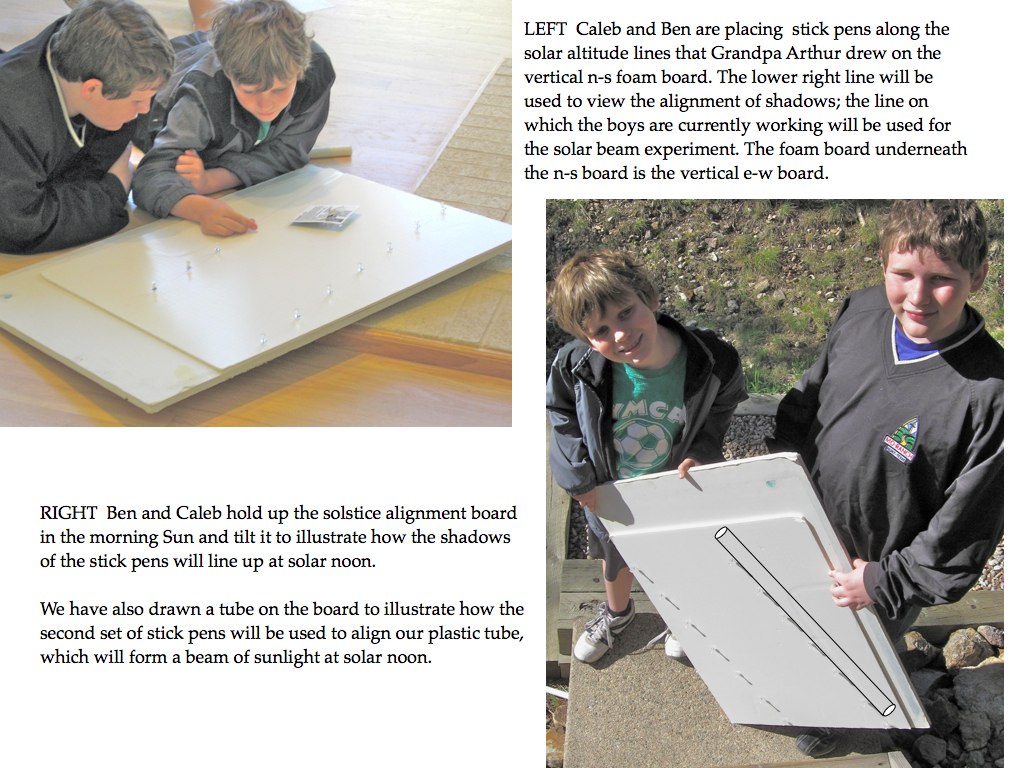
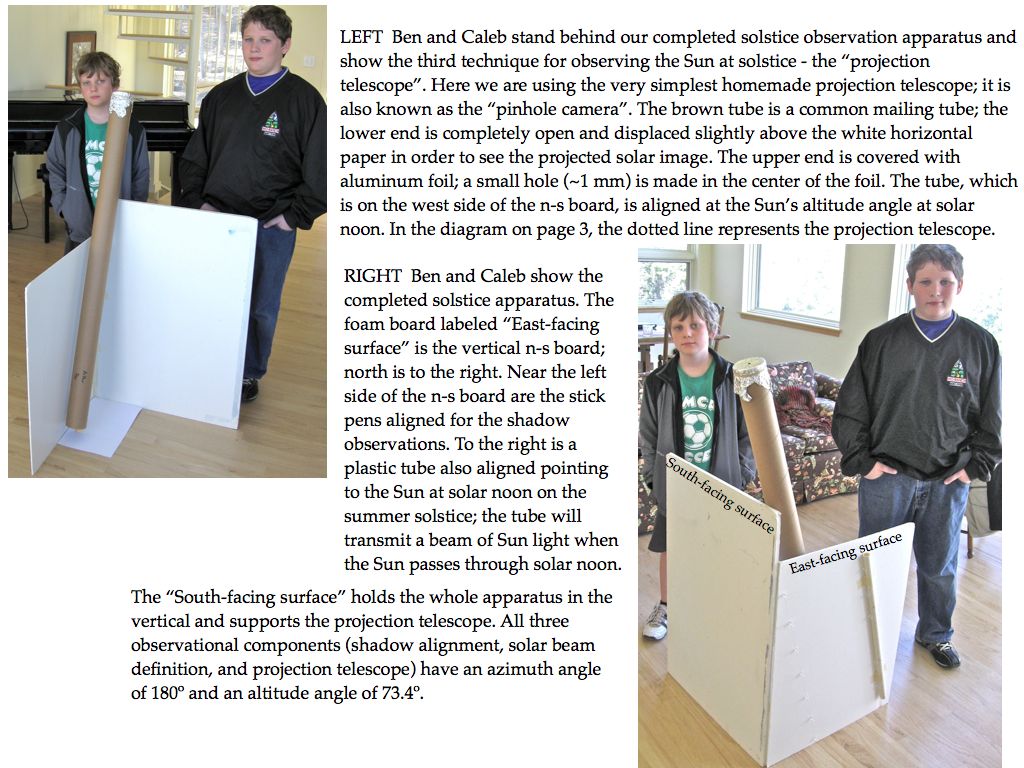
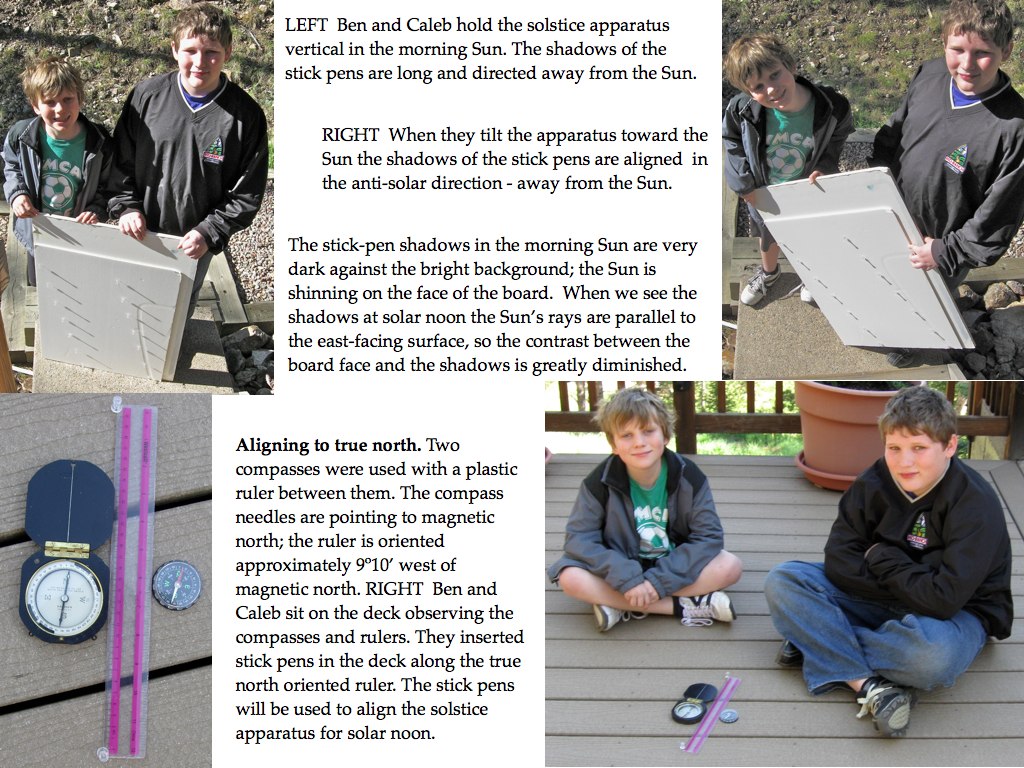
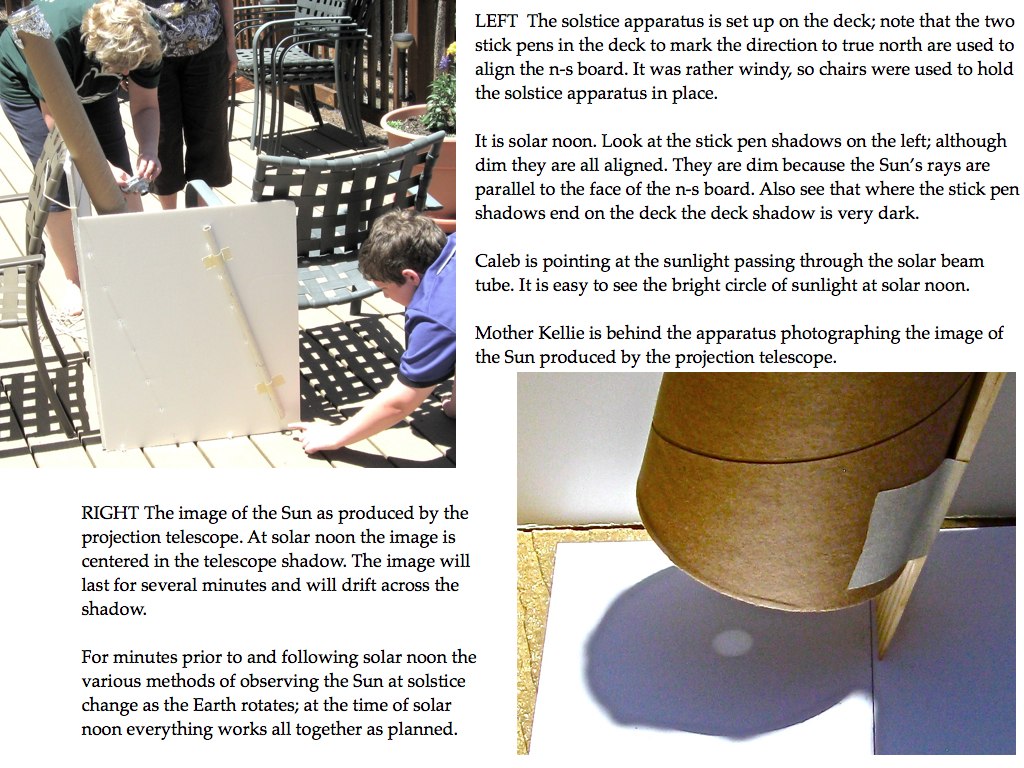
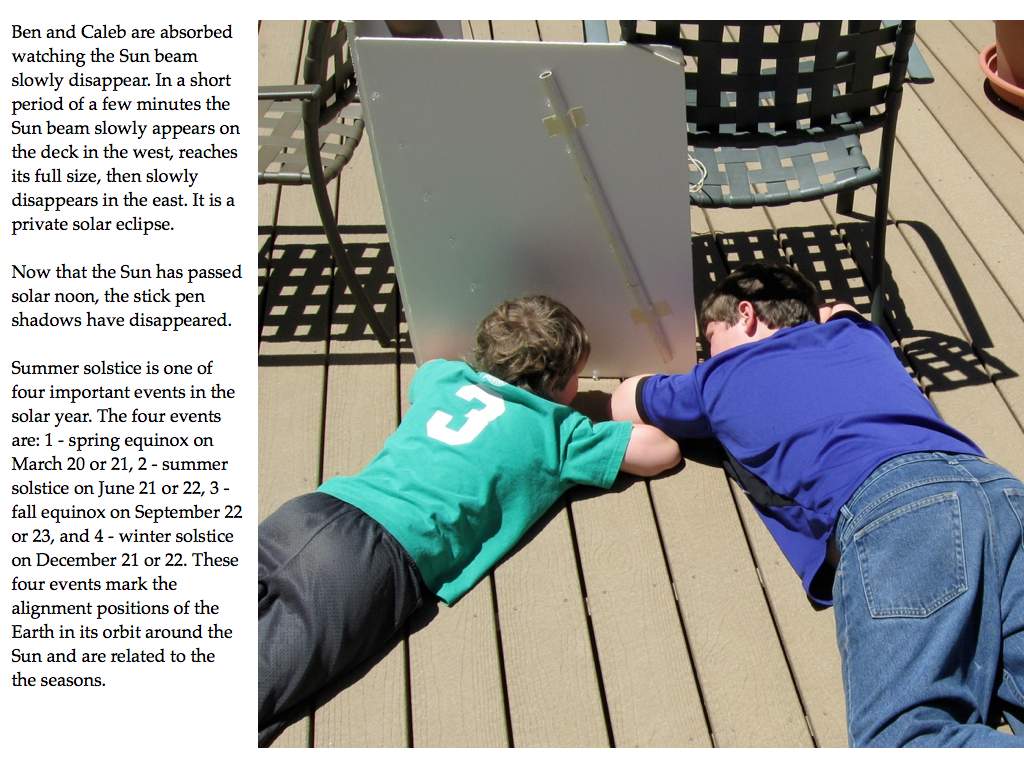
17. The boys and I will be in
Gold Hill on the solstice; can we celebrate?
Kellie
18. The aurora is occasionally seen far south of it's usual high latitude location. What conditions cause it to be seen far south? Karen
A plasma is a collection of very hot ionized atoms, and in our case these would be positive ions (mostly protons) and electrons. They are so hot that they cannot recombine to form atoms, and in the solar wind they are have a low concentration (~ 5 ions/cm3). The plasma can exert two forms of pressure: kinetic pressure from hot ion motion and dynamic flow pressure of the plasma. These are analogous to the pressure of the air and the pressure of wind.
Now we introduce a magnetic field in the plasma. The ions and electrons can easily move parallel to the magnetic lines but cannot move perpendicular to the magnetic lines; rather they move in spirals around them. The magnetic field thus exerts a pressure on the plasma, which is perpendicular to the magnetic field. Scientists working with magnetized plasma have a rule called “frozen in flux;” the flux being the magnetic field lines, which are attached to the plasma. If the dynamic pressure of the plasma exceeds the magnetic pressure then the plasma can drag the magnetic field along with the plasma flow. However, if the magnetic pressure exceeds the dynamic pressure, then the magnetic pressure can control the plasma.
The temperature of the visible surface of the Sun, the photosphere, is ~ 5800 ºK, but above the visible surface in the corona the temperature is ~ 2,000,000 ºK. This produces an extreme kinetic pressure that accelerates the solar plasma outward. This outward dynamic pressure exceeds the solar magnetic pressure; hence the solar plasma drags the solar magnetic field stretching and weakening the solar embedded magnetic field. When reaching the Earth’s vicinity the speed of the wind is ~ 400 km/s, which is supersonic, and the plasma temperature is ~150,000 ºK.

The
simplified diagram above provides an
outline of the solar wind interaction
with the Earth’s magnetic field.
In region A on the left the dominant
pressure is the dynamic pressure of the
supersonic solar wind. The thin vertical
lines represent the solar magnetic
fields embedded in the solar wind.
The thin curved lines represent the magnetic field lines of the Earth. Note that the field lines from the polar regions extend farther out into space than do the field lines from lower latitudes. When the solar wind encounters the Earth’s magnetic field it is the stretched polar field lines that experience the greatest impact. The Earth pushes back on the solar wind and slows it down; a bow shock is formed when the solar wind is slowed from supersonic to sonic in region B. At the magnetopause the Earth’s magnetic pressure is equal to the solar wind’s dynamic pressure and the solar wind is forced to go around the Earth’s magnetic field.
In this
process the solar field lines can
connect to Earth field lines in a
process called reconnection. As
indicated in the drawing it is the polar
field lines that participate in the
reconnection process; the field lines
from lower latitudes remain inside the
magnetopause. The solar wind can then
drag the magnetopause away from Earth
forming the magnetotail, which can be
very long.

Since plasma can flow parallel to field lines, the reconnected field lines allow the solar plasma to flow along the Earth’s field lines into the polar regions producing aurora.
Solar
activity increases the density and speed
of the solar wind; these factors
increase the dynamic pressure of the
solar wind. With the increased dynamic
pressure the solar wind can push harder
on the Earth’s magnetic field and drag
additional field lines down the
magnetotail. These additional field
lines are from lower latitudes; hence
the auroral zone will move toward the
equator.
Seasonal
Effects - Good Cop, Bad Cop

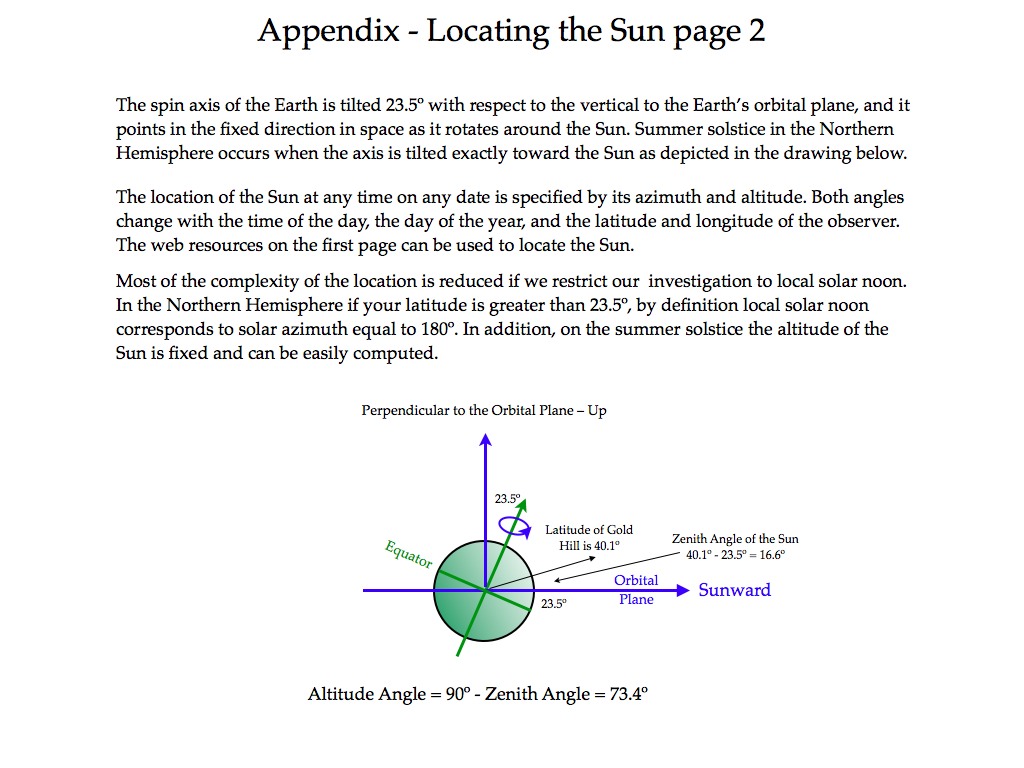
The
graphic above illustrates the 23.5º
tilt of the Earth’s rotational axis with
respect to the vertical perpendicular to
the orbital plane. In addition, the
Earth’s magnetic axis is tilted
approximately 11º with respect to
the rotational axis. As the Earth
rotates, the magnetic axis rotates about
the rotational axis.
At the northern hemisphere summer
solstice (left above), at the time when
the north magnetic field is aligned
Sunward the magnetic axis makes an angle
of 34.5º with respect to the
vertical to the orbital plane or
55.5º to the Earth-Sun line.
Twelve hours later when the magnetic
axis has rotated to the opposite side of
the rotational axis the angle between
the magnetic axis and the vertical to
the orbital plane is 12.5º or
77.5º to the Earth-Sun line. The
magnetic pole is tilted toward the Sun.
At the winter solstice (right above) the
rotational axis is 23.5º but tilted
away from the Sun. The +11º and
-11º variation in the magnetic axis
due to Earth’s rotation is insufficient
to direct the north magnetic pole
sunward.
At the equinoxes the magnetic pole moves
back forth 11º toward the Sun and
11º away from the Sun.
Owing
to the tilt of the Earth’s axis
(23.5º) and the displacement of the
magnetic axis (~11º) from the
rotational axis, The relationship of the
Earth’s magnetic pole to the Sun has
both diurnal and annual variations.
These geometric changes have a effect on
aurora sightings.
The simplified drawings of the
interaction between the solar wind and
the Earth’s magnetic field used above
assumed a highly symmetric relationship,
which rarely occurs.
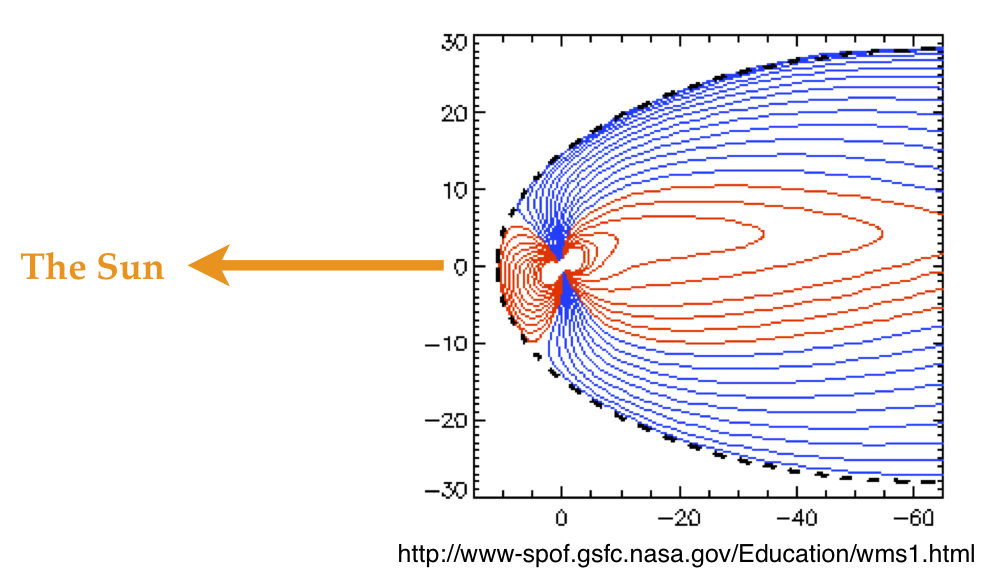
The computer simulation depicted in the
drawing below illustrates the more
common relationship of the Earth’s
interaction with the solar wind; the
magnetic pole is tilted with respect to
the solar wind. Upon close inspection
you will see that the distorted Earth
field lines are not symmetric.
This tilt toward the Sun exposes more of
the magnetic field lines to the pressure
of the solar wind, and the solar wind
magnetic field will connect to Earth’s
field and drag them back to the tail.
These additional field lines come from
latitudes lower than traditional aurora.
This configuration is similar to the
northern hemisphere summer. We would
anticipate that there would be more
lower latitude aurora sightings in
northern hemisphere summer (good cop);
however, long days and extended twilight
reduce the time for dark observing
conditions (bad cop). During northern
hemisphere winter with long dark nights
(good cop), the north magnetic pole is
tilted away from the Sun and the lower
latitude field lines are shielded from
the solar wind (bad cop).
1. The magnetic field of the Sun is highly erratic; see the X-ray image below on the left. Unlike the Earth which has a reasonably well defined N-S polar structure; the Sun’s magnetic fields are dominated by by localized regions of activity. As the solar wind drags these field lines outward they retain their arbitrary orientation. When arriving at the Earth the solar wind magnetic field may point up or down or at other angles.
2. Although these solar magnetic structures are somewhat small compared to the size of the Sun; when they expand into space their size may increase by as much as two orders of magnitude.
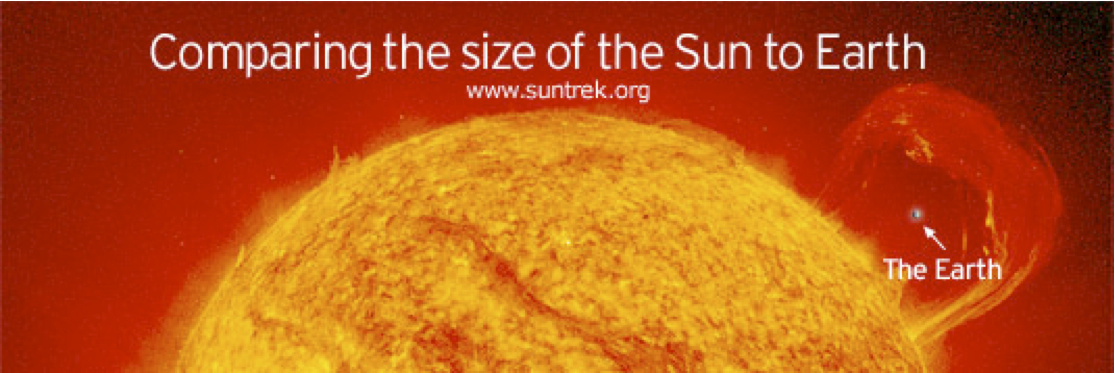
3. The Earth is minuscule compared to the size of the solar wind structures. In the illustration below right the Earth is shown inside a solar prominence, which is a large magnetic structure. The magnetic structure will grow as it expands, but the Earth will not.
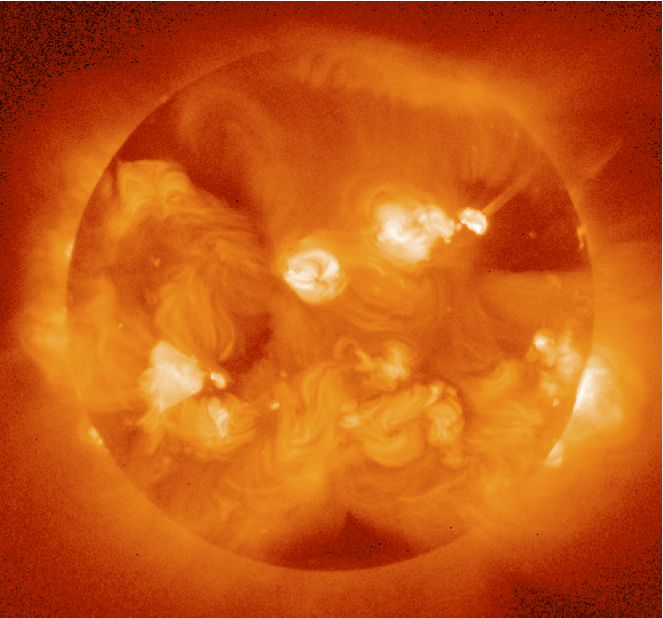
LEFT. This image is a full-disk view of the X-ray Sun and was produced by the Yohkoh solar observatory in 1991. The structures that can be seen consist of large and hot (>2MK) coronal magnetic structures. This particular image, one of millions, shows a quite active corona from near the maximum of the solar cycle. At the upper right (solar northwest) one can see an "X-ray jet") squirting outwards - this was one of Yohkoh's original discoveries.
RIGHT. http://www.suntrek.org/sun-as-a-star/sun-and-earth/comparing-size-sun-and-earth.shtml
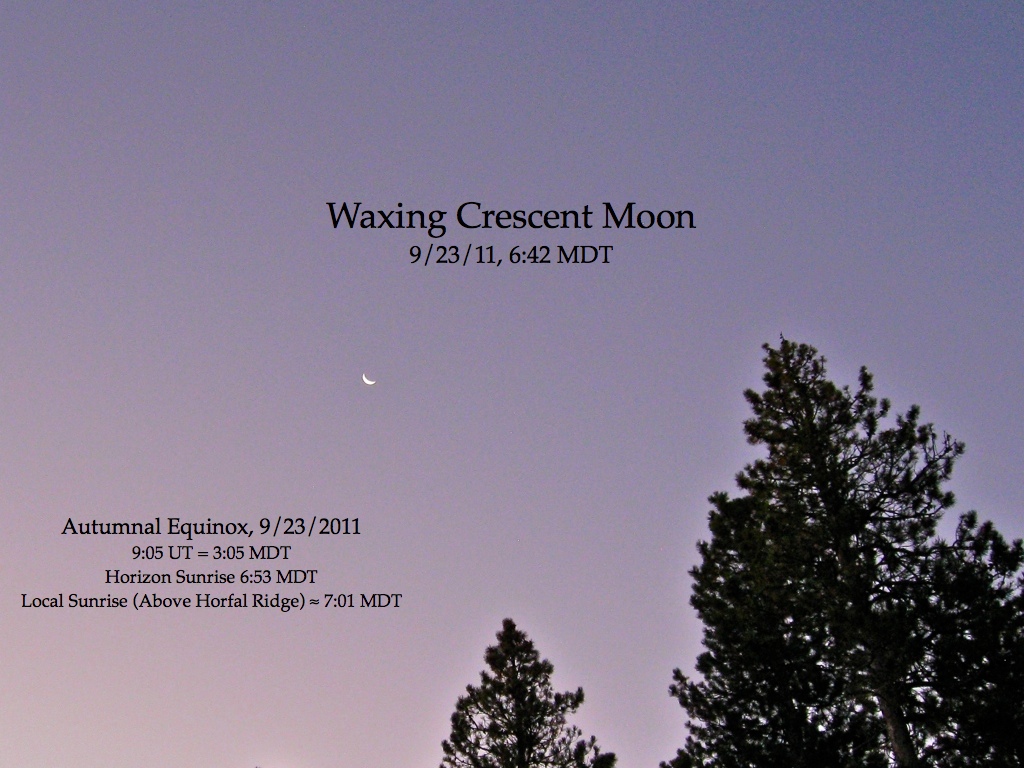
The autumnal equinox occurs this morning (9/23/11) at 3:05 MDT (9:05 UT). This event occurs only once every year, and marks the moment that the subsolar point on the Earth crosses the equator from the northern to the southern hemisphere. The common interpretation that this marks the date that the length of the day and night are equal is only approximately the case
There were other predawn jewels to see in the sky this “Good Morning”: the planets Jupiter above and Mars eastward in the predawn sector, the constellation Orion dominating the sky to the south was supported by bright stars Aldebran and Sirius, and we do not forget, of course, the crescent Moon near the west horizon.
Finally, there is the Belt of Venus that occurs in the western horizon just prior to sunrise. The Belt of Venus is produced by sunrise occurring in the upper atmosphere prior to sunrise at the surface. See the “Ask Arthur” explanation #12 on this web site.
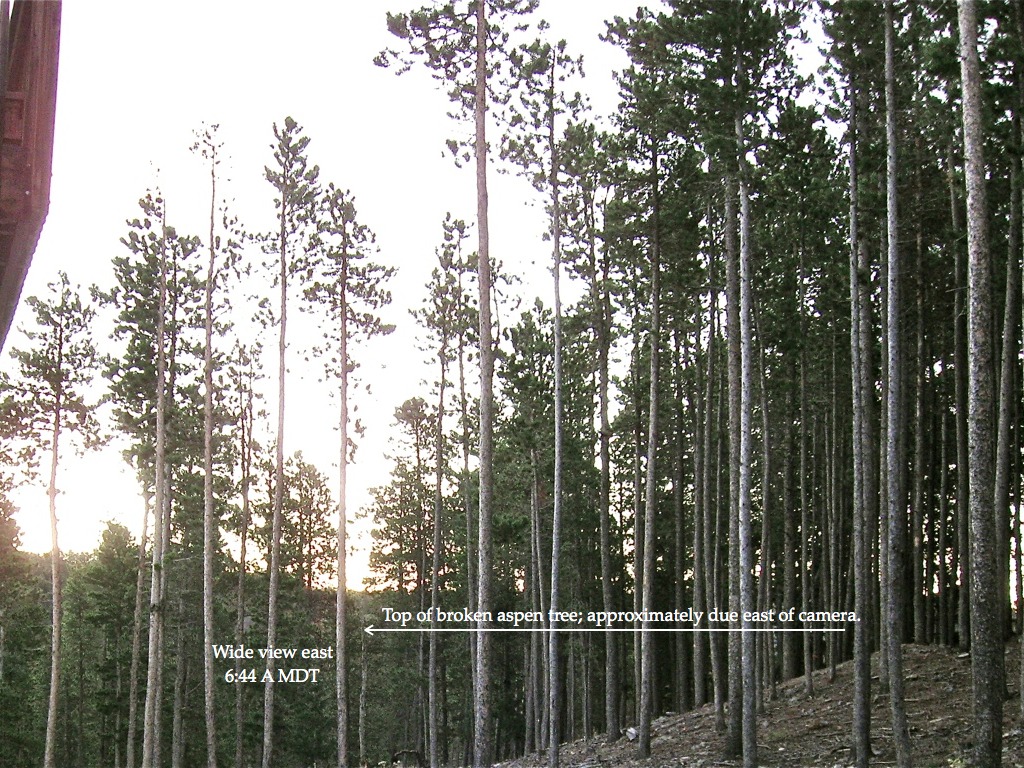
Please enjoy the photographs below all of which were taken on this “Good Morning”
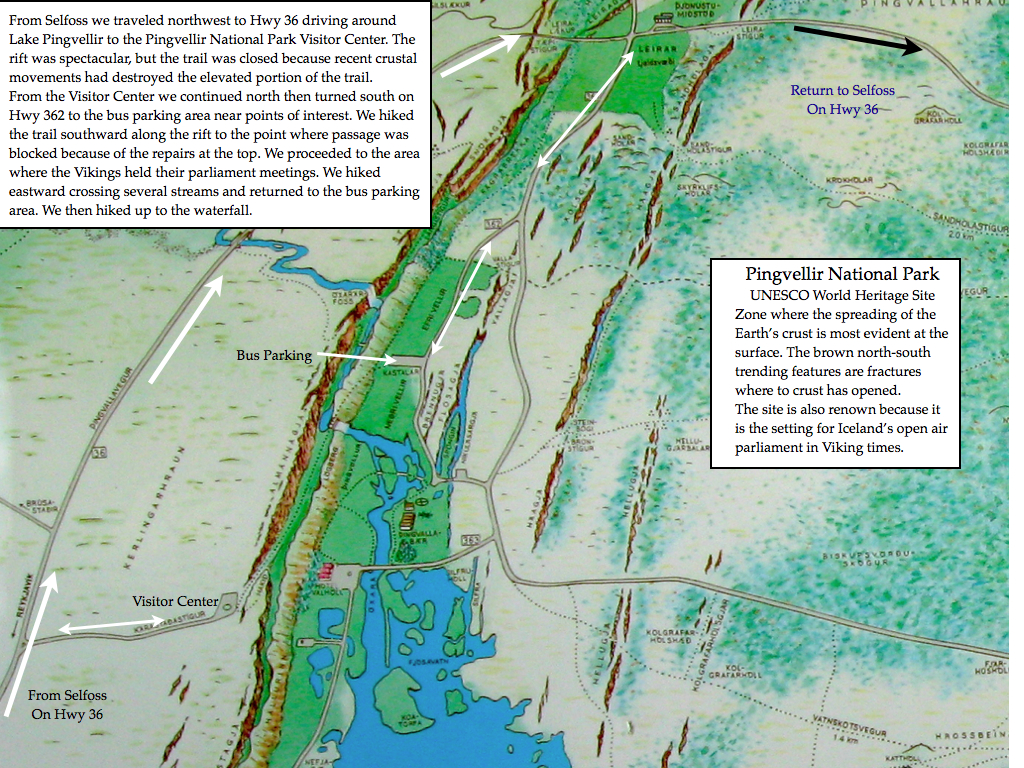
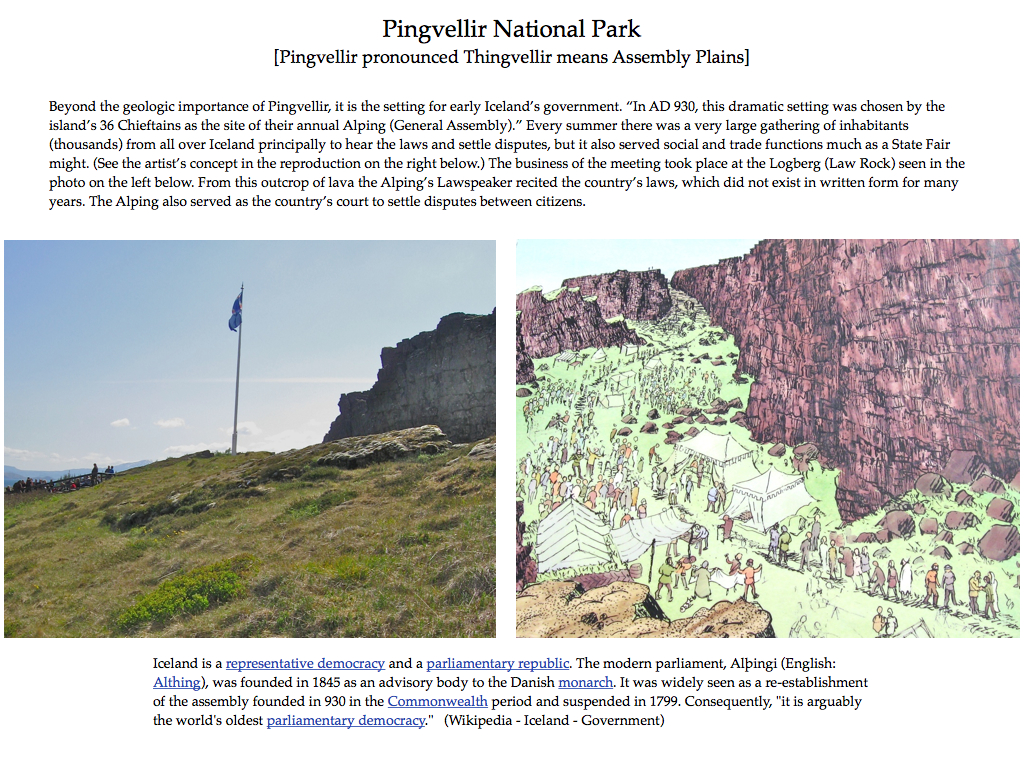
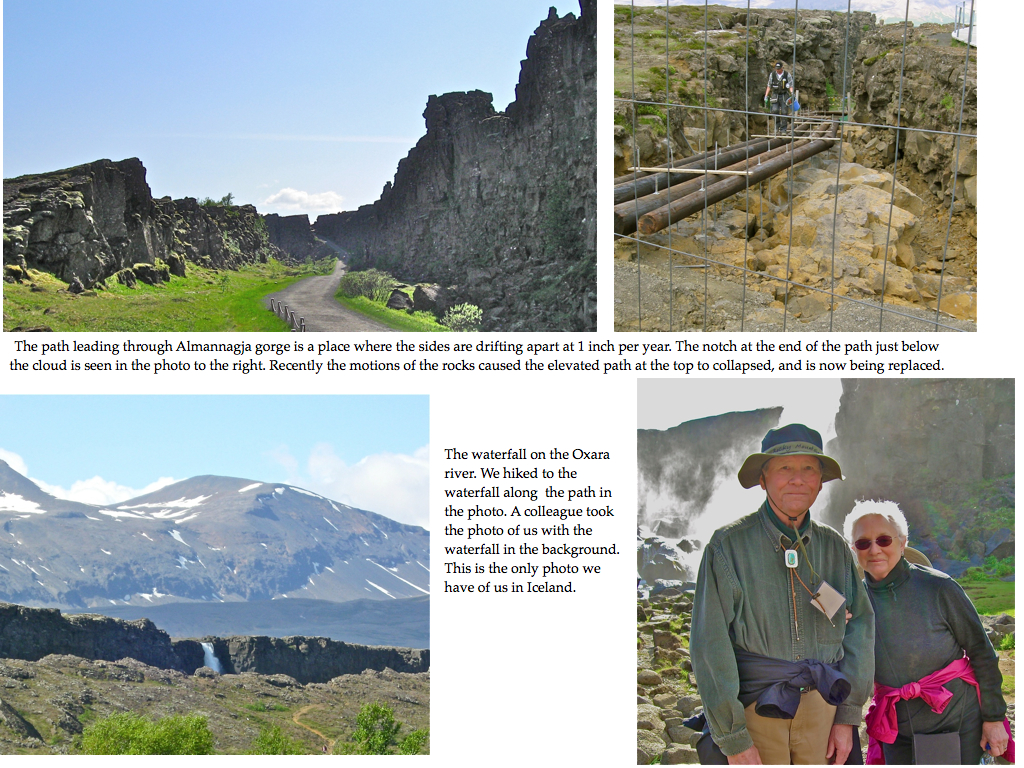
20.
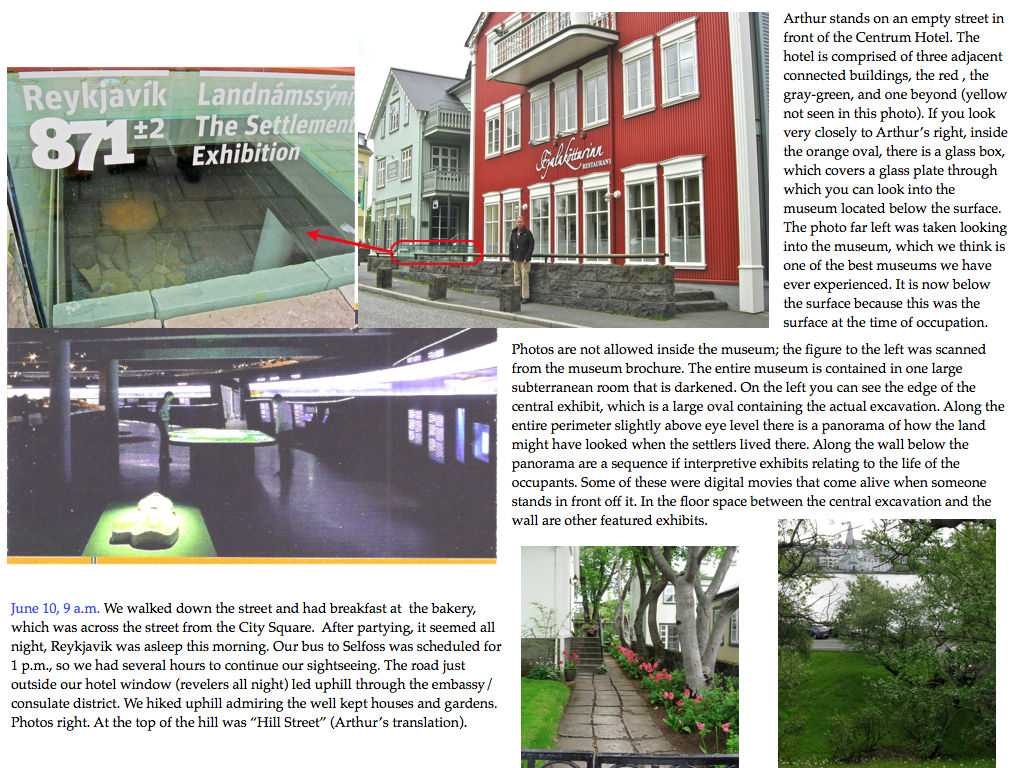
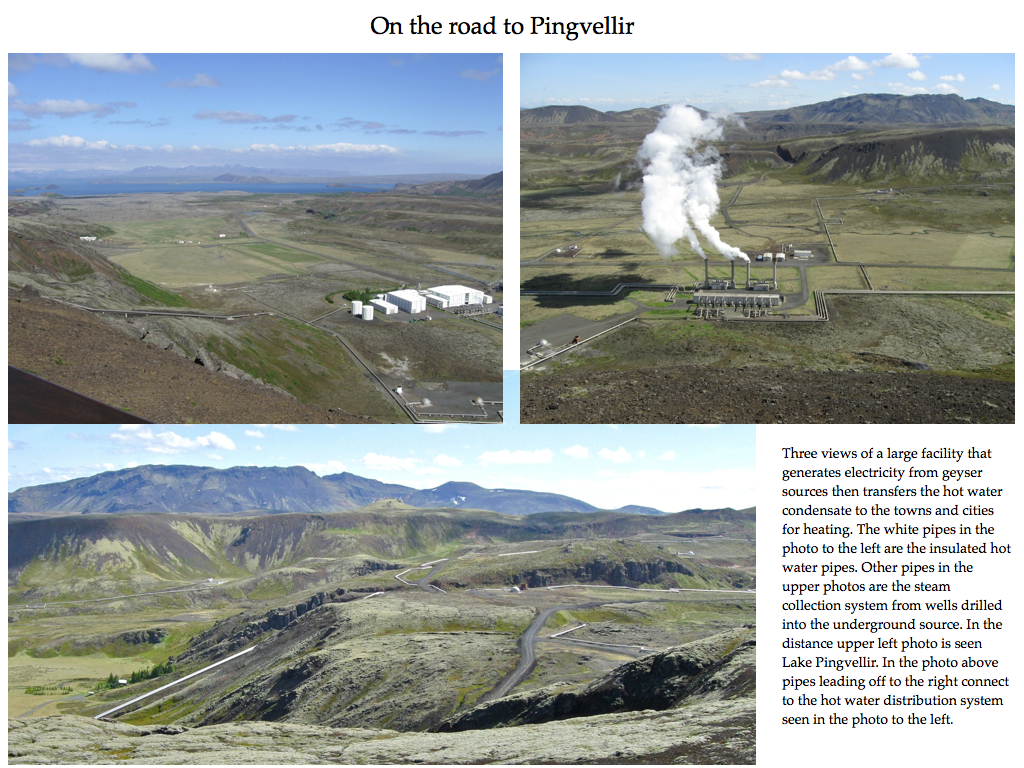
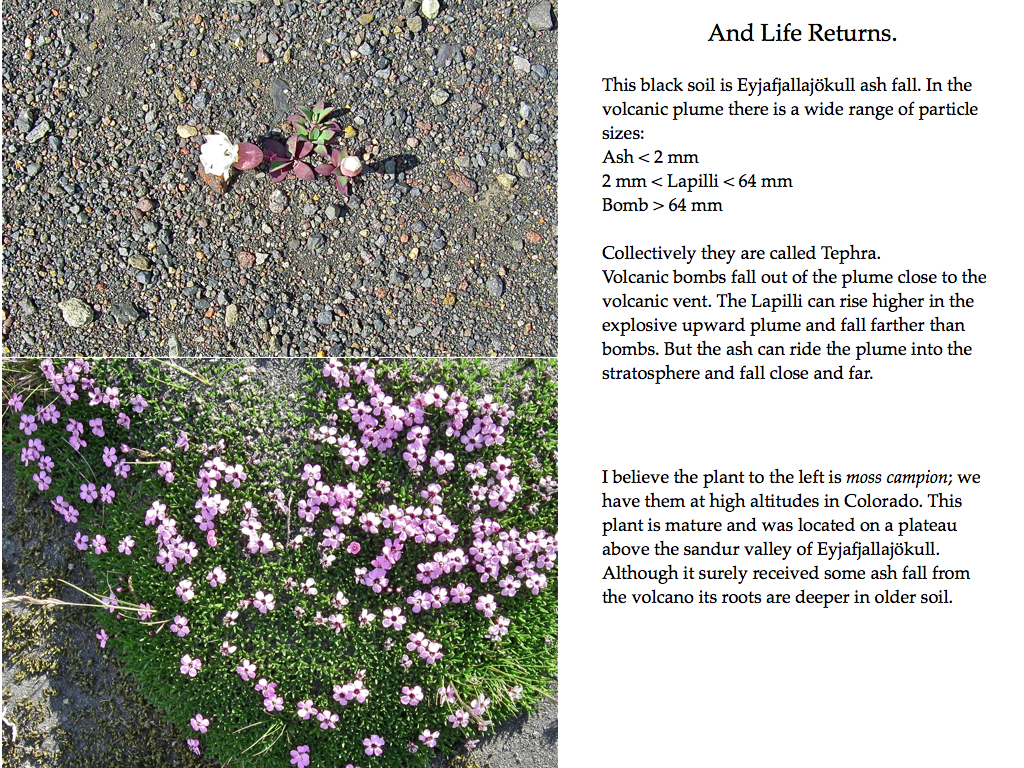
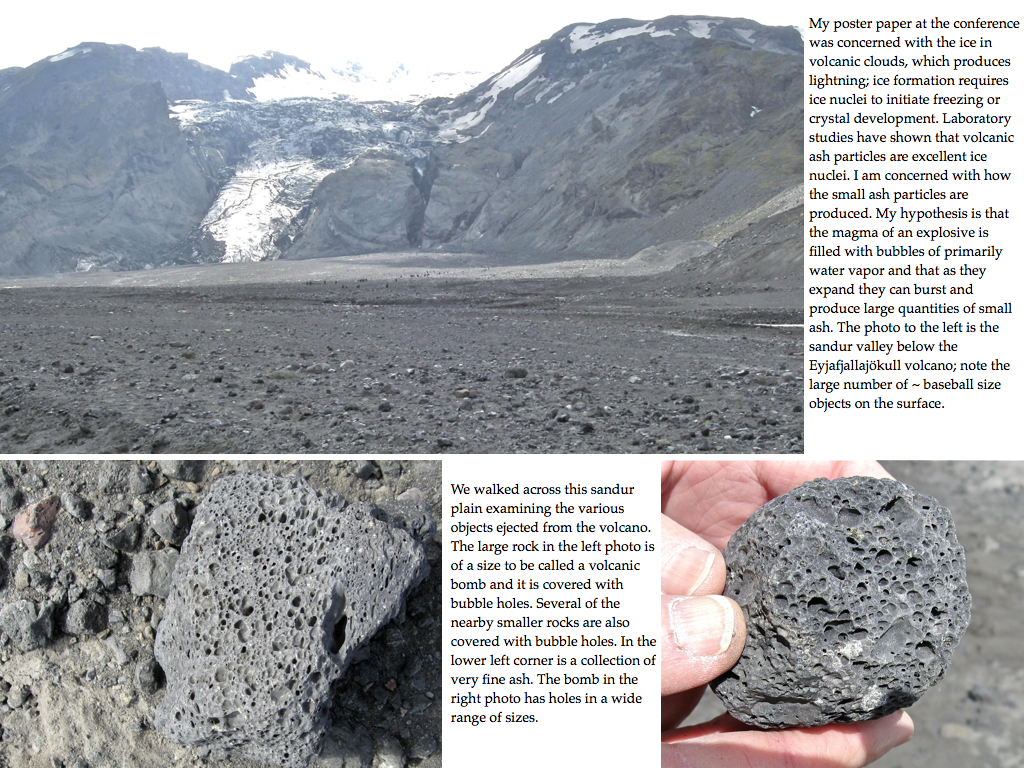
If you would like to see Arthur's poster paper presented at the conference click here.